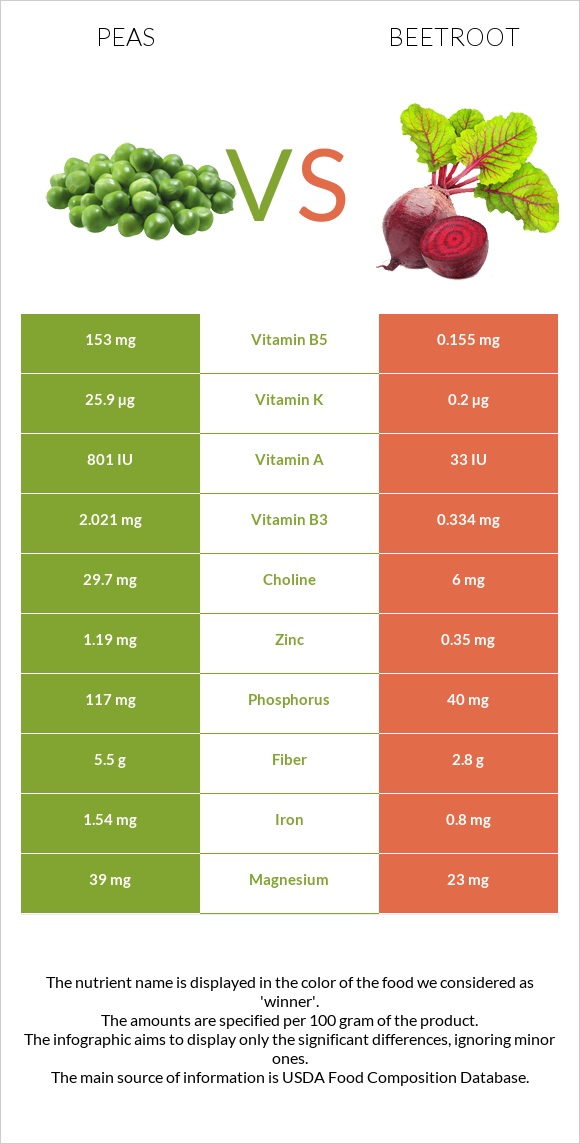
A recap on the differences between peas and beetroot Peas have more vitamin B5, vitamin K, vitamin B1, vitamin A, vitamin B6, phosphorus, copper, fiber, and vitamin B3; however, beetroot is higher in folate. Peas cover your daily vitamin B5 needs 3057% more than beetroot. Beetroot contains 130 times less vitamin K than peas. Peas contain 25.9µg of vitamin K, while beetroot contains 0.2µg. Food varieties used in this article are Peas, green, cooked, boiled, drained, without salt and Beets, raw .
Infographic
Mineral Comparison
Mineral comparison score is based on the number of minerals by which one or the other food is richer. The "coverage" charts below show how much of the daily needs can be covered by 300 grams of the food.
9
100 g
300 g
1 cup - 160g
Magnesium
Magnesium
Calcium
Calcium
Potassium
Potassium
Iron
Iron
Copper
Copper
Zinc
Zinc
Phosphorus
Phosphorus
Sodium
Sodium
Manganese
Manganese
Selenium
Selenium
28%
8.1%
24%
58%
58%
32%
50%
0.39%
68%
10%
1
100 g
300 g
1 beet (2" dia) - 82g 1 cup - 136g
Magnesium
Magnesium
Calcium
Calcium
Potassium
Potassium
Iron
Iron
Copper
Copper
Zinc
Zinc
Phosphorus
Phosphorus
Sodium
Sodium
Manganese
Manganese
Selenium
Selenium
16%
4.8%
29%
30%
25%
9.5%
17%
10%
43%
3.8%
Vitamin Comparison
Vitamin comparison score is based on the number of vitamins by which one or the other food is richer. The "coverage" charts below show how much of the daily needs can be covered by 300 grams of the food.
9
100 g
300 g
1 cup - 160g
Vitamin C
Vit. C
Vitamin D
Vit. D
Vitamin A
Vit. A
Vitamin E
Vit. E
Vitamin B1
Vit. B1
Vitamin B2
Vit. B2
Vitamin B3
Vit. B3
Vitamin B5
Vit. B5
Vitamin B6
Vit. B6
Vitamin B12
Vit. B12
Vitamin K
Vit. K
Folate
Folate
47%
0%
13%
2.8%
65%
34%
38%
9180%
50%
0%
65%
47%
1
100 g
300 g
1 beet (2" dia) - 82g 1 cup - 136g
Vitamin C
Vit. C
Vitamin D
Vit. D
Vitamin A
Vit. A
Vitamin E
Vit. E
Vitamin B1
Vit. B1
Vitamin B2
Vit. B2
Vitamin B3
Vit. B3
Vitamin B5
Vit. B5
Vitamin B6
Vit. B6
Vitamin B12
Vit. B12
Vitamin K
Vit. K
Folate
Folate
16%
0%
0.67%
0.8%
7.8%
9.2%
6.3%
9.3%
15%
0%
0.5%
82%
All nutrients comparison - raw data values
Nutrient
DV% diff.
Vitamin B5
153mg
0.155mg
3057%
Vitamin K
25.9µg
0.2µg
21%
Vitamin B1
0.259mg
0.031mg
19%
Folate
63µg
109µg
12%
Fiber
5.5g
2.8g
11%
Copper
0.173mg
0.075mg
11%
Phosphorus
117mg
40mg
11%
Vitamin B3
2.021mg
0.334mg
11%
Vitamin B6
0.216mg
0.067mg
11%
Vitamin C
14.2mg
4.9mg
10%
Iron
1.54mg
0.8mg
9%
Manganese
0.525mg
0.329mg
9%
Protein
5.36g
1.61g
8%
Zinc
1.19mg
0.35mg
8%
Vitamin B2
0.149mg
0.04mg
8%
Magnesium
39mg
23mg
4%
Vitamin A
40µg
2µg
4%
Choline
29.7mg
6mg
4%
Sodium
3mg
78mg
3%
Calories
84kcal
43kcal
2%
Carbs
15.63g
9.56g
2%
Potassium
271mg
325mg
2%
Selenium
1.9µg
0.7µg
2%
Calcium
27mg
16mg
1%
Vitamin E
0.14mg
0.04mg
1%
Fructose
0.41g
1%
Protein per 100 calories
6.4g
3.7g
N/A
Calories per 10 g protein
157kcal
267kcal
N/A
Weight per 100 calories
119g
233g
N/A
Fats
0.22g
0.17g
0%
Net carbs
10.13g
6.76g
N/A
Sugar
5.93g
6.76g
N/A
Saturated fat
0.039g
0.027g
0%
Monounsaturated fat
0.019g
0.032g
0%
Polyunsaturated fat
0.102g
0.06g
0%
Tryptophan
0.037mg
0.019mg
0%
Threonine
0.201mg
0.047mg
0%
Isoleucine
0.193mg
0.048mg
0%
Leucine
0.32mg
0.068mg
0%
Lysine
0.314mg
0.058mg
0%
Methionine
0.081mg
0.018mg
0%
Phenylalanine
0.198mg
0.046mg
0%
Valine
0.232mg
0.056mg
0%
Histidine
0.105mg
0.021mg
0%
Macronutrient Comparison
Macronutrient breakdown side-by-side comparison
3
5%
16%
78%
Protein:
5.36 g
Fats:
0.22 g
Carbs:
15.63 g
Water:
77.87 g
Other:
0.92 g
2
10%
88%
Protein:
1.61 g
Fats:
0.17 g
Carbs:
9.56 g
Water:
87.58 g
Other:
1.08 g
Contains
more
Protein Protein
+232.9%
Contains
more
Fats Fats
+29.4%
Contains
more
Carbs Carbs
+63.5%
Contains
more
Water Water
+12.5%
Contains
more
Other Other
+17.4%
Fat Type Comparison
Fat type breakdown side-by-side comparison
1
24%
12%
64%
Saturated fat:
Sat. Fat
0.039 g
Monounsaturated fat:
Mono. Fat
0.019 g
Polyunsaturated fat:
Poly. Fat
0.102 g
2
23%
27%
50%
Saturated fat:
Sat. Fat
0.027 g
Monounsaturated fat:
Mono. Fat
0.032 g
Polyunsaturated fat:
Poly. Fat
0.06 g
Contains
more
Poly. Fat Polyunsaturated fat
+70%
Contains
less
Sat. Fat Saturated fat
-30.8%
Contains
more
Mono. Fat Monounsaturated fat
+68.4%