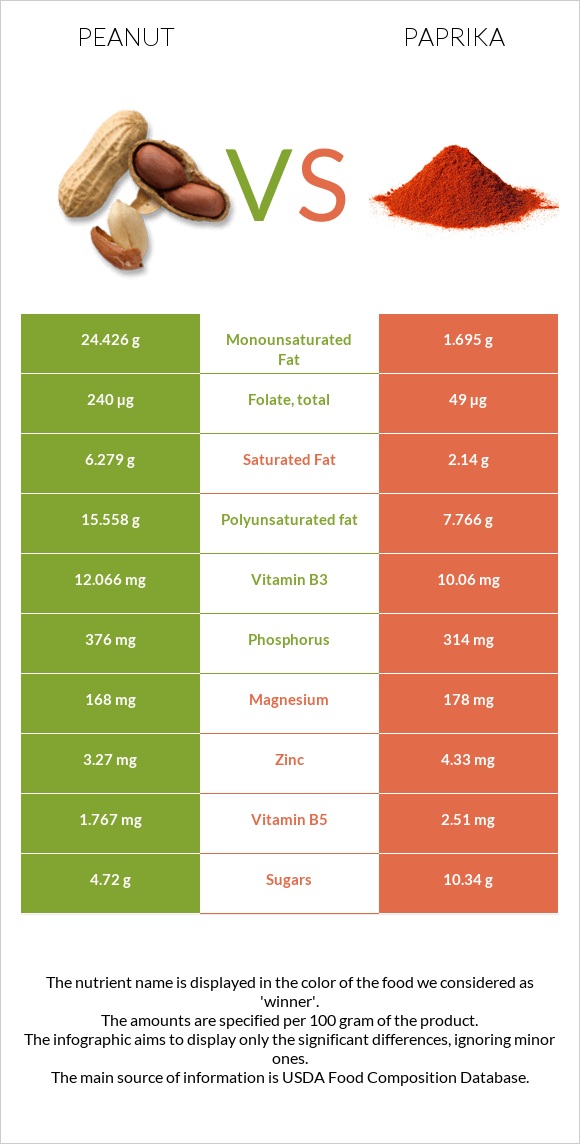
A recap on the differences between peanuts and paprika Peanuts are higher in copper and folate, yet paprika is higher in vitamin A, iron, vitamin E, vitamin B6, fiber, vitamin B2, vitamin K, and potassium. Paprika covers your daily vitamin A needs 985% more than peanuts. Peanuts contain 5 times more folate than paprika. While peanuts contain 240µg of folate, paprika contains only 49µg. The glycemic index of paprika is lower. Food varieties used in this article are Peanuts, all types, raw and Spices, paprika .
Infographic
Mineral Comparison
Mineral comparison score is based on the number of minerals by which one or the other food is richer. The "coverage" charts below show how much of the daily needs can be covered by 300 grams of the food.
5
100 g
300 g
1 oz - 28.35g 1 cup - 146g
Magnesium
Magnesium
Calcium
Calcium
Potassium
Potassium
Iron
Iron
Copper
Copper
Zinc
Zinc
Phosphorus
Phosphorus
Sodium
Sodium
Manganese
Manganese
Selenium
Selenium
120%
28%
62%
172%
381%
89%
161%
2.3%
252%
39%
4
100 g
300 g
0.25 tsp - 0.5g 1 tbsp - 6.8g
Magnesium
Magnesium
Calcium
Calcium
Potassium
Potassium
Iron
Iron
Copper
Copper
Zinc
Zinc
Phosphorus
Phosphorus
Sodium
Sodium
Manganese
Manganese
Selenium
Selenium
127%
69%
201%
793%
238%
118%
135%
8.9%
207%
34%
Vitamin Comparison
Vitamin comparison score is based on the number of vitamins by which one or the other food is richer. The "coverage" charts below show how much of the daily needs can be covered by 300 grams of the food.
3
100 g
300 g
1 oz - 28.35g 1 cup - 146g
Vitamin C
Vit. C
Vitamin D
Vit. D
Vitamin A
Vit. A
Vitamin E
Vit. E
Vitamin B1
Vit. B1
Vitamin B2
Vit. B2
Vitamin B3
Vit. B3
Vitamin B5
Vit. B5
Vitamin B6
Vit. B6
Vitamin B12
Vit. B12
Vitamin K
Vit. K
Folate
Folate
0%
0%
0%
167%
160%
31%
226%
106%
80%
0%
0%
180%
7
100 g
300 g
0.25 tsp - 0.5g 1 tbsp - 6.8g
Vitamin C
Vit. C
Vitamin D
Vit. D
Vitamin A
Vit. A
Vitamin E
Vit. E
Vitamin B1
Vit. B1
Vitamin B2
Vit. B2
Vitamin B3
Vit. B3
Vitamin B5
Vit. B5
Vitamin B6
Vit. B6
Vitamin B12
Vit. B12
Vitamin K
Vit. K
Folate
Folate
3%
0%
821%
582%
83%
284%
189%
151%
494%
0%
201%
37%
All nutrients comparison - raw data values
Nutrient
DV% diff.
Vitamin A
0µg
2463µg
274%
Iron
4.58mg
21.14mg
207%
Vitamin E
8.33mg
29.1mg
138%
Vitamin B6
0.348mg
2.141mg
138%
Fiber
8.5g
34.9g
106%
Vitamin B2
0.135mg
1.23mg
84%
Vitamin K
0µg
80.3µg
67%
Monounsaturated fat
24.426g
1.695g
57%
Fats
49.24g
12.89g
56%
Polyunsaturated fat
15.558g
7.766g
52%
Copper
1.144mg
0.713mg
48%
Folate
240µg
49µg
48%
Potassium
705mg
2280mg
46%
Vitamin B1
0.64mg
0.33mg
26%
Protein
25.8g
14.14g
23%
Saturated fat
6.279g
2.14g
19%
Manganese
1.934mg
1.59mg
15%
Vitamin B5
1.767mg
2.51mg
15%
Calories
567kcal
282kcal
14%
Calcium
92mg
229mg
14%
Carbs
16.13g
53.99g
13%
Vitamin B3
12.066mg
10.06mg
13%
Zinc
3.27mg
4.33mg
10%
Phosphorus
376mg
314mg
9%
Fructose
6.71g
8%
Magnesium
168mg
178mg
2%
Sodium
18mg
68mg
2%
Selenium
7.2µg
6.3µg
2%
Vitamin C
0mg
0.9mg
1%
Protein per 100 calories
4.6g
5g
N/A
Calories per 10 g protein
220kcal
199kcal
N/A
Weight per 100 calories
18g
35g
N/A
Unsaturated / Saturated Fat ratio
6.4
4.4
N/A
Net carbs
7.63g
19.09g
N/A
Sugar
4.72g
10.34g
N/A
Choline
52.5mg
51.5mg
0%
Tryptophan
0.25mg
0.07mg
0%
Threonine
0.883mg
0.49mg
0%
Isoleucine
0.907mg
0.57mg
0%
Leucine
1.672mg
0.92mg
0%
Lysine
0.926mg
0.69mg
0%
Methionine
0.317mg
0.2mg
0%
Phenylalanine
1.377mg
0.61mg
0%
Valine
1.082mg
0.75mg
0%
Histidine
0.652mg
0.25mg
0%
Omega-3 - ALA
0.453g
N/A
Macronutrient Comparison
Macronutrient breakdown side-by-side comparison
2
26%
49%
16%
7%
2%
Protein:
25.8 g
Fats:
49.24 g
Carbs:
16.13 g
Water:
6.5 g
Other:
2.33 g
3
14%
13%
54%
11%
8%
Protein:
14.14 g
Fats:
12.89 g
Carbs:
53.99 g
Water:
11.24 g
Other:
7.74 g
Contains
more
Protein Protein
+82.5%
Contains
more
Fats Fats
+282%
Contains
more
Carbs Carbs
+234.7%
Contains
more
Water Water
+72.9%
Contains
more
Other Other
+232.2%
Fat Type Comparison
Fat type breakdown side-by-side comparison
2
14%
53%
34%
Saturated fat:
Sat. Fat
6.279 g
Monounsaturated fat:
Mono. Fat
24.426 g
Polyunsaturated fat:
Poly. Fat
15.558 g
1
18%
15%
67%
Saturated fat:
Sat. Fat
2.14 g
Monounsaturated fat:
Mono. Fat
1.695 g
Polyunsaturated fat:
Poly. Fat
7.766 g
Contains
more
Mono. Fat Monounsaturated fat
+1341.1%
Contains
more
Poly. Fat Polyunsaturated fat
+100.3%
Contains
less
Sat. Fat Saturated fat
-65.9%