Peanut butter, chunky, vitamin and mineral fortified vs. Peanut butter, smooth, vitamin and mineral fortified — In-Depth Nutrition Comparison
Compare
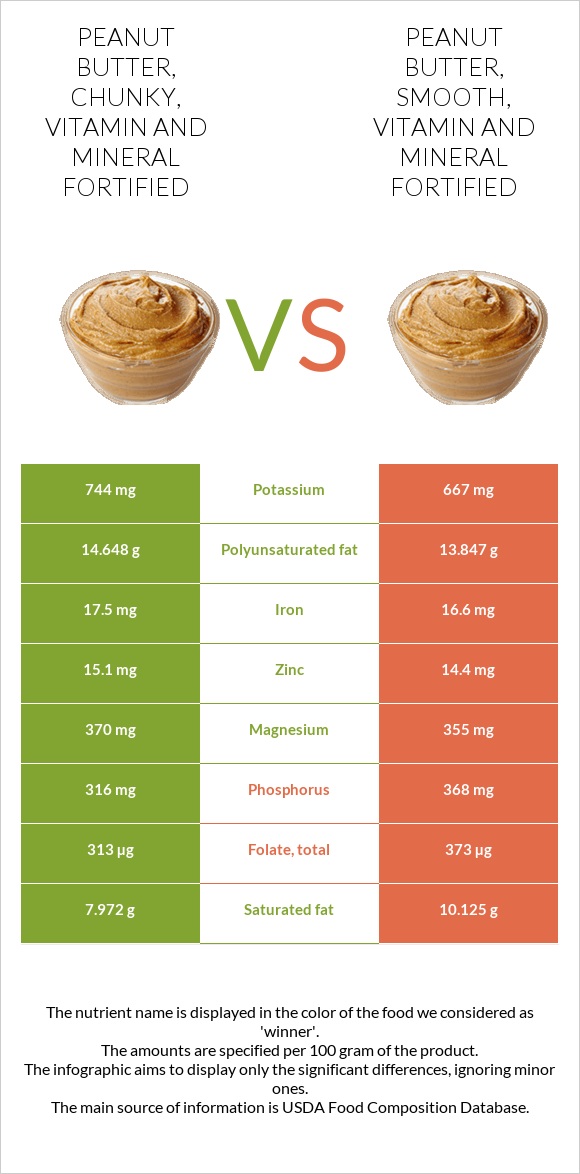
Differences between peanut butter, chunky, vitamin and mineral fortified and peanut butter, smooth, vitamin and mineral fortified
- Peanut butter, chunky, vitamin, and mineral fortified has more vitamin B6, copper, iron, zinc, and polyunsaturated fat, while peanut butter, smooth, vitamin, and mineral fortified has more folate and phosphorus.
- Peanut butter, chunky, vitamin, and mineral fortified's daily need coverage for vitamin B6 is 22% higher.
- The amount of saturated fat in peanut butter, chunky, vitamin, and mineral fortified is lower.
The food types used in this comparison are Peanut butter, chunky, vitamin, and mineral fortified and Peanut butter, smooth, vitamin, and mineral fortified.
Infographic
Infographic link
Mineral Comparison
Mineral comparison score is based on the number of minerals by which one or the other food is richer. The "coverage" charts below show how much of the daily needs can be covered by 300 grams of the food.
| Contains more PotassiumPotassium | +11.5% |
| Contains less SodiumSodium | -12.9% |
| Contains more PhosphorusPhosphorus | +16.5% |
Vitamin Comparison
Vitamin comparison score is based on the number of vitamins by which one or the other food is richer. The "coverage" charts below show how much of the daily needs can be covered by 300 grams of the food.
| Contains more Vitamin B1Vitamin B1 | +50.6% |
| Contains more Vitamin B6Vitamin B6 | +13% |
| Contains more Vitamin KVitamin K | +20% |
| Contains more FolateFolate | +19.2% |
All nutrients comparison - raw data values
| Nutrient |  |
|
DV% diff. |
| Vitamin B6 | 2.52mg | 2.23mg | 22% |
| Folate | 313µg | 373µg | 15% |
| Copper | 1.77mg | 1.64mg | 14% |
| Iron | 17.5mg | 16.6mg | 11% |
| Saturated fat | 7.972g | 10.125g | 10% |
| Phosphorus | 316mg | 368mg | 7% |
| Zinc | 15.1mg | 14.4mg | 6% |
| Polyunsaturated fat | 14.648g | 13.847g | 5% |
| Magnesium | 370mg | 355mg | 4% |
| Vitamin B1 | 0.125mg | 0.083mg | 4% |
| Potassium | 744mg | 667mg | 2% |
| Sodium | 366mg | 420mg | 2% |
| Vitamin B3 | 13.64mg | 13.369mg | 2% |
| Protein | 26.06g | 25.72g | 1% |
| Fats | 51.47g | 50.81g | 1% |
| Vitamin B2 | 0.112mg | 0.105mg | 1% |
| Monounsaturated fat | 24.366g | 24.832g | 1% |
| Calories | 593kcal | 591kcal | 0% |
| Protein per 100 calories | 4.4g | 4.4g | N/A |
| Calories per 10 g protein | 228kcal | 230kcal | N/A |
| Weight per 100 calories | 17g | 17g | N/A |
| Unsaturated / Saturated Fat ratio | 4.9 | 3.8 | N/A |
| Net carbs | 11.99g | 13.15g | N/A |
| Carbs | 17.69g | 18.75g | 0% |
| Calcium | 45mg | 43mg | 0% |
| Sugar | 10.94g | 10.47g | N/A |
| Fiber | 5.7g | 5.6g | 0% |
| Vitamin A | 1172µg | 1172µg | 0% |
| Vitamin E | 43.2mg | 43.2mg | 0% |
| Selenium | 7.5µg | 7.5µg | 0% |
| Vitamin K | 0.5µg | 0.6µg | 0% |
| Choline | 61.1mg | 63.3mg | 0% |
Macronutrient Comparison
Macronutrient breakdown side-by-side comparison
Protein:
26.06 g
Fats:
51.47 g
Carbs:
17.69 g
Water:
1.48 g
Other:
3.3 g
Protein:
25.72 g
Fats:
50.81 g
Carbs:
18.75 g
Water:
1.47 g
Other:
3.25 g
~equal in
Protein
~25.72g
~equal in
Fats
~50.81g
~equal in
Carbs
~18.75g
~equal in
Water
~1.47g
~equal in
Other
~3.25g
Fat Type Comparison
Fat type breakdown side-by-side comparison
Saturated fat:
Sat. Fat
7.972 g
Monounsaturated fat:
Mono. Fat
24.366 g
Polyunsaturated fat:
Poly. Fat
14.648 g
Saturated fat:
Sat. Fat
10.125 g
Monounsaturated fat:
Mono. Fat
24.832 g
Polyunsaturated fat:
Poly. Fat
13.847 g
| Contains less Sat. FatSaturated fat | -21.3% |
~equal in
Monounsaturated fat
~24.832g
~equal in
Polyunsaturated fat
~13.847g