Pecan vs. Almonds — Health Impact and Nutrition Comparison


Summary
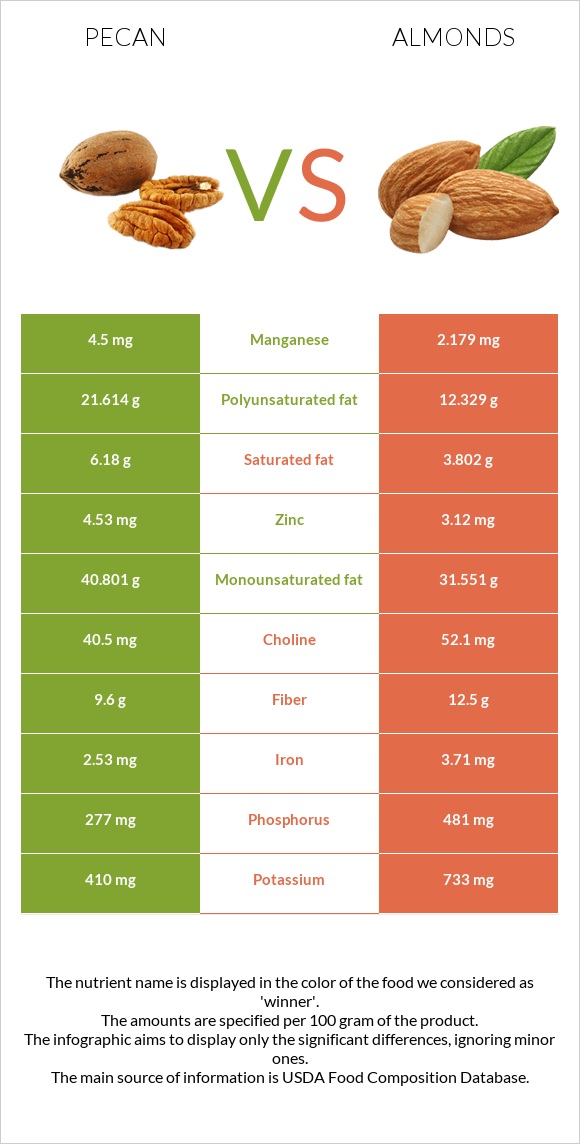
Pecans are richer in fats, particularly polyunsaturated (omega-3 omega-6) and monounsaturated fats. They also contain more zinc, manganese, vitamin A, and vitamin K.
Almonds are richer in fiber, proteins, iron, selenium, vitamin E, vitamin B3, and folate.
Introduction
Almonds are thought to have originated in Western Asia and minor Asian territories. The almond tree has been domesticated since the early bronze era (3000 BC). They can be ground into flour, processed into milk, spread, or eaten raw or roasted.
On the other hand, pecan is native to the North American continent. They are widely found in Georgia, Texas, and New Mexico. They can be used and processed into different food products, such as milk flour, and eaten raw or roasted.
This article will discuss the difference between pecan and almond regarding different variables. These differences are according to their generalities, nutritional content, and health impacts.
General difference
The general difference between pecan and almond is their price and culinary usage.
Culinary usage
It is important to mention that these nuts can be made into non-dairy milk. One of the most common non-dairy milk is almond. However, pecan milk can also be found in the market.
Almonds and pecans have wide culinary usage. Pecans make pies and baked sweets; almond is also used in dessert making. Using almonds as a base filler in middle eastern sweets is widespread.
Almond flour is also famously used in the keto diet because it is lower in carbs than wheat flour.
In addition to that, almond and pecan milk are good alternative non-dairy milk for vegans to consume.
Nutrition
Calories
Pecans are higher in calories than almonds. They have 691 calories per 100g, while almonds contain 579 calories.
Overall both nuts are high in calories.
Carbs
Almonds contain higher amounts of carbs than pecans. Almond contains 21.55g of carbs per 100g, and pecans have 13.86g.
Carbohydrate type comparison
Contains
more
StarchStarch
+56.5%
Contains
more
GlucoseGlucose
+325%
Contains
more
FructoseFructose
+175%
Contains
more
MaltoseMaltose
+∞%
Contains
more
GalactoseGalactose
+∞%
Fibers
Almonds are excellent sources of fiber, containing 12.5g per 100g, whereas almonds have 9.6g.
Glycemic index
The glycemic index of almonds is 0, which is lower than that of pecan, with a glycemic index equal to 10. It is important to note that the glycemic index of pecan is considered low.
Proteins
Almonds contain much higher amounts of proteins compared to pecan.
Almond is richer in proteins by 2.2 times more than pecan.
Fats
The highest macronutrient in both these foods is the amount of fat distributed among them. Pecan is higher in fats 72g out of 100g of pecan is made up of fats. On the other hand, when it comes to almonds, 50g out of 100g is fat.
We can say 72% of pecan is fat, and 50% of almonds is fat.
Discussing fat distribution among these foods is essential as they are the highest composition.
The fat is distributed among almonds and pecan among saturated and unsaturated fats. However, these fats are mainly distributed among unsaturated fats. The highest ratio is polyunsaturated fats. By default, pecan contains more polyunsaturated and monounsaturated fats because it contains an additional 22g of total fats compared to almonds.
Pecans are richer in omega-3 and omega-6 fatty acids.
Fat Type Comparison
Contains
more
Mono. FatMonounsaturated fat
+29.3%
Contains
more
Poly. FatPolyunsaturated fat
+75.3%
Contains
less
Sat. FatSaturated fat
-38.5%
Minerals
Almonds are a great source of minerals.
Almonds are richer in calcium, phosphorus, iron, magnesium, and potassium. The amount of calcium is 2 times higher in almonds.
On the other hand, pecans are higher in zinc and manganese.
Below we can see the chart that displays the distribution of these minerals and shows how much of the RDV of each mineral is satisfied for each nut.
Mineral Comparison
Contains
more
CopperCopper
+16.4%
Contains
more
ZincZinc
+45.2%
Contains
less
SodiumSodium
-100%
Contains
more
ManganeseManganese
+106.5%
Contains
more
MagnesiumMagnesium
+123.1%
Contains
more
CalciumCalcium
+284.3%
Contains
more
PotassiumPotassium
+78.8%
Contains
more
IronIron
+46.6%
Contains
more
PhosphorusPhosphorus
+73.6%
Vitamins
Almond is richer in vitamin B3, folate, and vitamin E. The amount of vitamin E is 25 times higher in almonds.
Pecan is richer in vitamin A and vitamin K.
The chart below shows the vitamin distribution for each and their RDV satisfaction for each vitamin.
Vitamin Comparison
Contains
more
Vitamin CVitamin C
+∞%
Contains
more
Vitamin AVitamin A
+∞%
Contains
more
Vitamin B1Vitamin B1
+222%
Contains
more
Vitamin B5Vitamin B5
+83.2%
Contains
more
Vitamin B6Vitamin B6
+53.3%
Contains
more
Vitamin KVitamin K
+∞%
Contains
more
Vitamin EVitamin E
+1730.7%
Contains
more
Vitamin B2Vitamin B2
+775.4%
Contains
more
Vitamin B3Vitamin B3
+210%
Contains
more
FolateFolate
+100%
Health impacts
Cardiovascular
Almonds consumption can help to decrease blood cholesterol levels, which reduces the risk of coronary heart disease (CHD) by 20%. This will result in a myocardial infarction, often known as a heart attack, if left untreated and unmonitored.
Another effect is on the body's vasculature. Almonds should be consumed at least five times a week to reduce the risk of cardiovascular disease (CVD). (2)
Like almonds, pecans have cardioprotective properties. They lower cardiac disease markers such as hyperlipidemia and high cholesterol levels and reduce the risks of cardiovascular disorders. (3)
Diabetes
The incorporation of almonds in the diet of a diabetic patient has been shown to improve insulin levels, glycemic control, and adipose levels. Overall if these are controlled with proper medication, there will be very low risks of complication development in the long-term management of diabetes. (4)
Flavonoids and phenolic compounds present in pecan have anti-diabetic properties, lowering overall blood glucose levels and providing glycemic control. In addition to this property, it contains anti-oxidant characteristics. (5)
Cancer
Pecan extract has been shown to have anticarcinogenic effects on breast cancer cell lines. (6)
Like pecan, almonds are protective in targeting breast cancer cell lines. (7)
References
- https://www.ncbi.nlm.nih.gov/pmc/articles/PMC5748761/
- https://www.ncbi.nlm.nih.gov/pmc/articles/PMC5762129/
- https://pubmed.ncbi.nlm.nih.gov/29534487/
- https://pubmed.ncbi.nlm.nih.gov/20580779/
- https://pubmed.ncbi.nlm.nih.gov/26450069/
- https://pubmed.ncbi.nlm.nih.gov/28807853/
- https://pubmed.ncbi.nlm.nih.gov/26183374/

Infographic
All nutrients comparison - raw data values
| Nutrient | |
|
DV% diff. |
| Vitamin E | 1.4mg | 25.63mg | 162% |
| Manganese | 4.5mg | 2.179mg | 101% |
| Vitamin B2 | 0.13mg | 1.138mg | 78% |
| Polyunsaturated fat | 21.614g | 12.329g | 62% |
| Vitamin B1 | 0.66mg | 0.205mg | 38% |
| Magnesium | 121mg | 270mg | 35% |
| Fats | 71.97g | 49.93g | 34% |
| Phosphorus | 277mg | 481mg | 29% |
| Protein | 9.17g | 21.15g | 24% |
| Monounsaturated fat | 40.801g | 31.551g | 23% |
| Calcium | 70mg | 269mg | 20% |
| Copper | 1.2mg | 1.031mg | 19% |
| Iron | 2.53mg | 3.71mg | 15% |
| Vitamin B3 | 1.167mg | 3.618mg | 15% |
| Zinc | 4.53mg | 3.12mg | 13% |
| Fiber | 9.6g | 12.5g | 12% |
| Saturated fat | 6.18g | 3.802g | 11% |
| Potassium | 410mg | 733mg | 10% |
| Vitamin B5 | 0.863mg | 0.471mg | 8% |
| Calories | 691kcal | 579kcal | 6% |
| Vitamin B6 | 0.21mg | 0.137mg | 6% |
| Folate | 22µg | 44µg | 6% |
| Carbs | 13.86g | 21.55g | 3% |
| Vitamin K | 3.5µg | 0µg | 3% |
| Choline | 40.5mg | 52.1mg | 2% |
| Vitamin C | 1.1mg | 0mg | 1% |
| Selenium | 3.8µg | 4.1µg | 1% |
| Protein per 100 calories | 1.3g | 3.7g | N/A |
| Calories per 10 g protein | 754kcal | 274kcal | N/A |
| Weight per 100 calories | 14g | 17g | N/A |
| Unsaturated / Saturated Fat ratio | 10 | 12 | N/A |
| Net carbs | 4.26g | 9.05g | N/A |
| Sugar | 3.97g | 4.35g | N/A |
| Starch | 0.46g | 0.72g | 0% |
| Sodium | 0mg | 1mg | 0% |
| Vitamin A | 3µg | 0µg | 0% |
| Trans fat | 0.015g | N/A | |
| Tryptophan | 0.093mg | 0.211mg | 0% |
| Threonine | 0.306mg | 0.601mg | 0% |
| Isoleucine | 0.336mg | 0.751mg | 0% |
| Leucine | 0.598mg | 1.473mg | 0% |
| Lysine | 0.287mg | 0.568mg | 0% |
| Methionine | 0.183mg | 0.157mg | 0% |
| Phenylalanine | 0.426mg | 1.132mg | 0% |
| Valine | 0.411mg | 0.855mg | 0% |
| Histidine | 0.262mg | 0.539mg | 0% |
| Fructose | 0.04g | 0.11g | 0% |
| Omega-3 - ALA | 0.003g | N/A | |
| Omega-6 - Eicosadienoic acid | 0g | 0.002g | N/A |
| Omega-6 - Linoleic acid | 12.32g | N/A |
Macronutrient Comparison
| Contains more FatsFats | +44.1% |
| Contains more ProteinProtein | +130.6% |
| Contains more CarbsCarbs | +55.5% |
| Contains more WaterWater | +25.3% |
| Contains more OtherOther | +100% |
People also compare


References
All the values for which the sources are not specified explicitly are taken from FDA’s Food Central. The exact link to the food presented on this page can be found below.
- Pecan - https://fdc.nal.usda.gov/fdc-app.html#/food-details/170182/nutrients
- Almonds - https://fdc.nal.usda.gov/fdc-app.html#/food-details/170567/nutrients
All the Daily Values are presented for males aged 31-50, for 2000-calorie diets.