Pecan Nutrition & Calories - Complete data of all nutrients
Introduction
Nuts are commonly referred to as superfoods due to their high nutritional value. This article focuses on the nutrition of one of the most common and widely used nuts, the pecan, describing its characteristics in detail using the latest research.
Nutrition
The nutritional infographics below are presented for 100g servings of raw pecans, taken from the USDA Food Database (1). However, we will also discuss the nutritional values of dry- or oil-roasted pecans with or without added salt (2, 3, 4).
The average serving size of pecans per person is 1 ounce or 28.35g, equal to 19 halves.
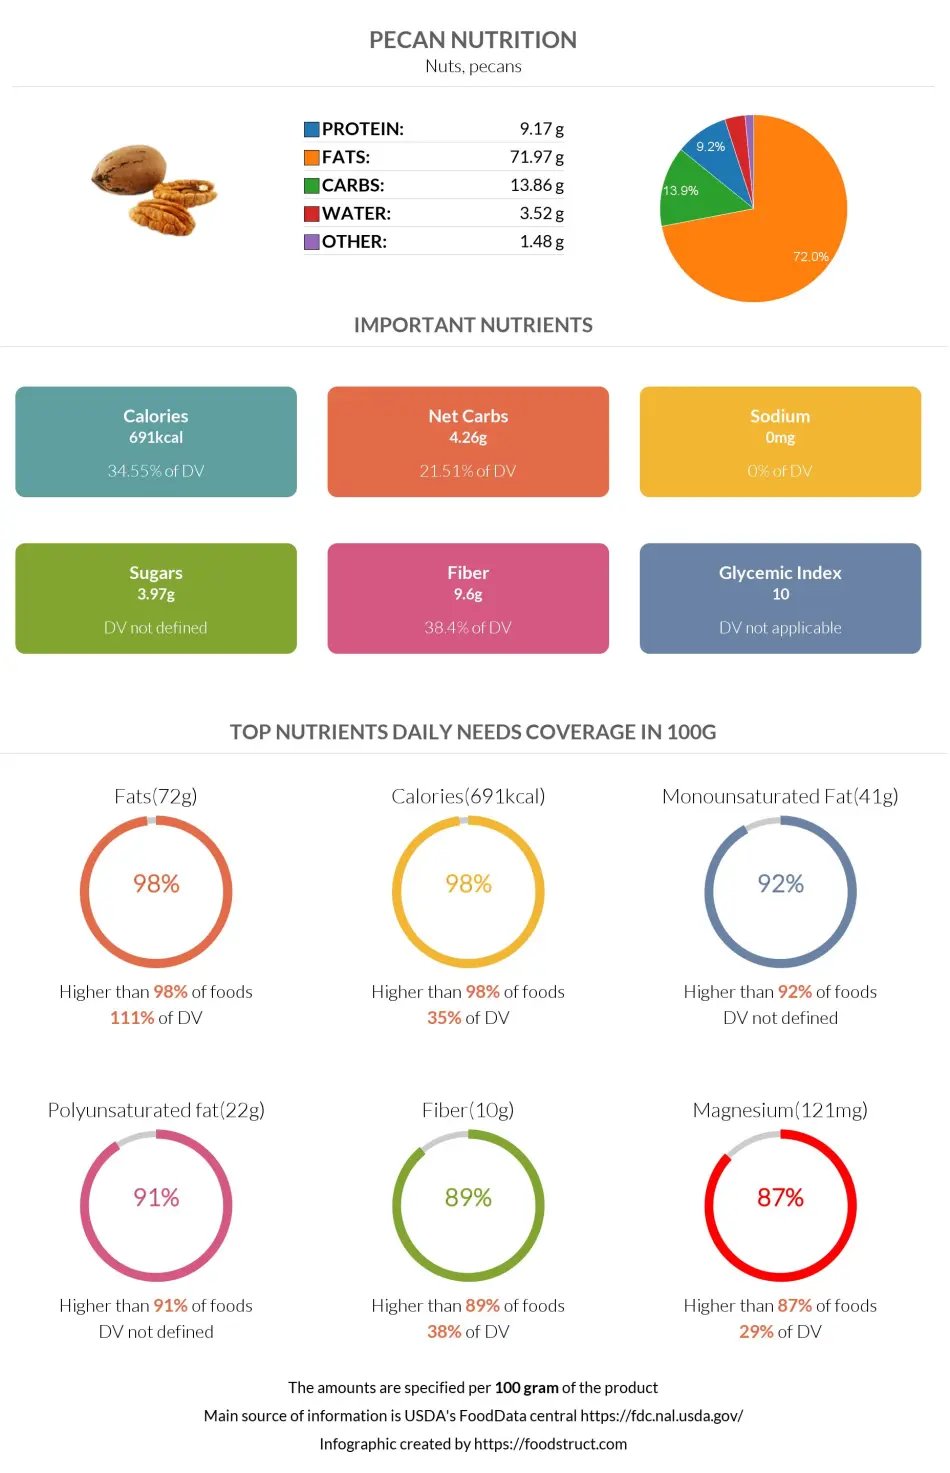
Pecans are incredibly dense in nutrients, consisting of 71% fats, 14% carbohydrates, and 10% protein. They are also rich in vital nutrients, such as fiber, copper, zinc, and thiamin (vitamin B1).
If you are seeking information regarding the health benefits of pecans, visit the link for a comprehensive overview.
Macronutrients chart
Calories
Pecans are incredibly calorie-dense, providing 691 calories per 100g serving and 197 calories per average serving. This makes pecans fall into the top 2% of foods in our database in terms of calories.
What Do 691 Calories or 100 Grams of Pecans Look Like?
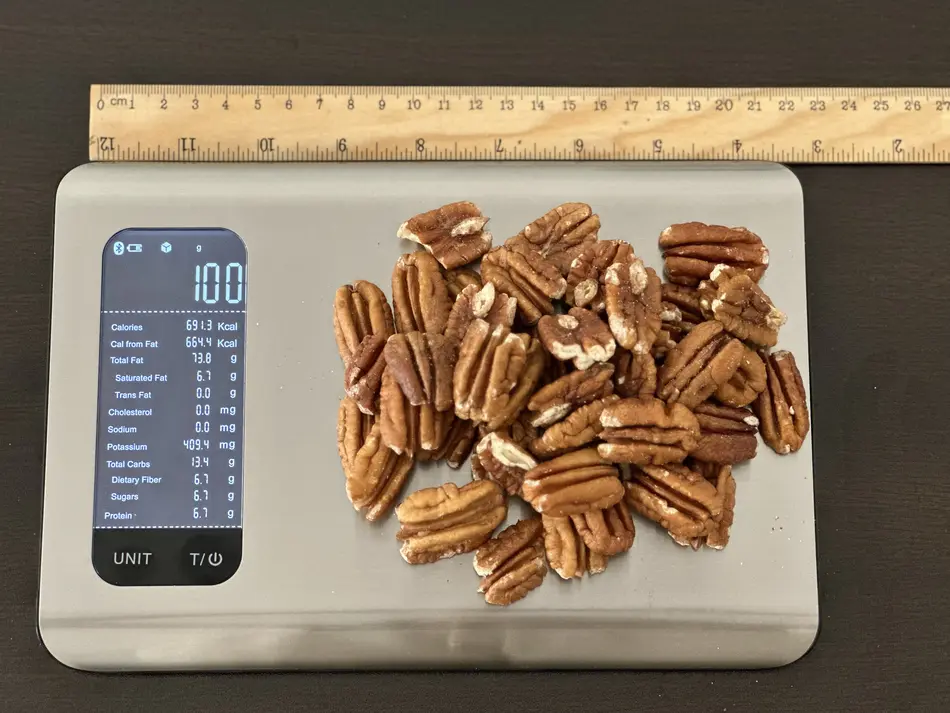
Our team measured how much 100 grams or 691 calories of pecan looks like. The picture above shows that 47 pecans comprise 100 grams. That means each pecan is about 2.13 grams or around 14.7 calories.
Remember that the calorie count can change based on the weight, size, and whether you eat the pecans raw or roasted. Roasted pecans are usually covered in unhealthy oils and sugar, which means they have extra calories that don't provide much nutrition.
A 100g serving of dry-roasted pecans provides 710 calories, while the same serving of oil-roasted pecans is even higher in calories - 715.
Fats
Pecans provide a very high amount of fats, consisting of nearly 72% of this nutrient. They fall in the range of the top 2% of foods as a source of fats, containing 71.97g per 100g or 20g per average serving. One hundred grams of pecans fully cover your daily fat needs.
Of these fats, 6.18g is saturated, 40.8g is monounsaturated, and 21.61g is polyunsaturated (including alpha-linolenic acid).
To put this in percentages, the fatty acid content of pecans consists of 9% saturated, 59% monounsaturated, and 32% polyunsaturated fats. The saturated fat content of pecans covers 31% of the daily needed value.
Pecans have no trans fats.
Fat type information
Unsurprisingly, dry-roasted pecans are higher in fats than raw pecans (by 2.3g), and oil-roasted pecans contain even more fats than dry-roasted ones (by 1g).
Cholesterol
Like all plant-based foods, pecans naturally have no cholesterol.
Oleic acid and Linoleic acid
Freshly extracted pecan oil contains approximately 27% oleic and 63% linoleic fatty acids (6). According to research, oleic acid may benefit heart health by lowering cholesterol and decreasing inflammation (7).
Linoleic acid plays a unique role in promoting heart health as well. Randomized clinical trials have shown that substituting linoleic acid for saturated fat lowers total and LDL cholesterol (8).
Carbohydrates
Pecans are relatively low in carbohydrates. 100g of pecan halves provide 13.86g of total carbohydrates; most of these are dietary fiber. However, pecans have a moderate amount of complex carbs, such as sucrose and starch, and a few simple carbs, such as glucose and fructose.
One average serving of pecans provides almost 4g of carbohydrates. Thus, pecans can be consumed during low-carb and keto diets but only in moderation.
Fiber content ratio for Pecan
Net Carbs
Of the 13.86g of carbs, 4.26g or 31% are net carbs. This average value corresponds to 4.46 % of the recommended dietary allowance in your diet.
Of these net carbs, 88% is comprised of sucrose, 10% is starch, and 2% is glucose and fructose.
Carbohydrate type breakdown
Soluble and Insoluble Dietary Fiber
Dietary fiber is one of the most important nutrients pecans provide. They fall in the top 11% of foods as a source of fiber, containing 4 times more of it than oranges. One ounce of pecans provides 10 % of the recommended daily value for fiber. It provides 2.5 g of fiber per serving and 9.6 g per 100g.
Fiber is a plant-based nutrient that comes in two main types: soluble fiber and insoluble fiber. Insoluble fiber helps digestion by allowing food to pass quickly through the digestive tract. Soluble fiber, on the other hand, aids digestion by slowing this process down.
While exact numbers have not yet been researched, we can assume that most of the fiber found in pecans is insoluble fiber, as nuts tend to be higher in this type.
Protein
Pecans are rich in high-quality protein. These nuts are an excellent plant-based source of protein. Pecans contain 2.6 grams of protein per ounce and 9.17 g per 100g, which covers 22% of the daily needed value of this nutrient.
The protein that pecans provide is of high quality, as it contains an adequate level of all essential amino acids. A 100g serving of these nuts covers over 100% of the daily need for histidine and tryptophan. Pecans are also relatively high in threonine, phenylalanine, and branched-chain amino acids (leucine, isoleucine, and valine). They contain moderate amounts of lysine and methionine.
Pecans are also rich in non-essential amino acids, such as aspartic, glutamic acid, glycine, proline, arginine, alanine, and serine.
Protein quality breakdown
Vitamins
Pecans are an excellent source of vitamins, containing moderate to high levels of over ten.
Pecans are rich in vitamin B1 or thiamine, containing 0.66g per 100g and falling in the top 14% of foods as its source. One average serving of pecans covers 30% of the daily requirement of vitamin B1.
Pecans are also rich in fat-soluble vitamins E and C. Pecans are an excellent source of vitamin E; they are mainly rich in gamma-tocopherol, providing about 25 g per 100 g.
Pantothenic acid (vitamin B5), folate (vitamin B9), pyridoxine (vitamin B6), riboflavin (vitamin B2), and niacin (vitamin B3) are some of the other B-complex vitamins found in pecan nuts in high or moderate amounts.
A 100-gram serving of pecans provides over 15% of your daily vitamin B6 and vitamin B5 values.
Pecans are absent in vitamin D and vitamin B12.
Vitamin coverage chart
Tocopherols
Tocopherols are one of the most important natural antioxidants found in plants. According to research, tocopherols have an antioxidant effect on the body, helping prevent oxidative stress. Pecans are a good source of γ-tocopherol but a poor source of α-tocopherol, with 24.4mg and 1.4mg per 100g of nut, respectively (9).
Pecans contain various flavonoid compounds, including proanthocyanidins or condensed tannins, monomers, and polymers of the flavan-3-ols unit. The high concentrations of γ-tocopherol and polymeric flavanols in pecans protect the unsaturated fats from oxidation (9).
Minerals
Pecans are rich in minerals. They have a high amount of copper (1.2mg per 100g), magnesium (121mg per 100g), phosphorus (277mg per 100g), and zinc (4.53mg per 100g). Pecans are also rich in potassium, manganese, iron, and calcium.
Pecans fall in the top 13% of foods as a source of magnesium, containing 1.2 times more of it than almonds. 100g of pecans can cover 40% of your daily magnesium need.
Pecans also fall in the top 17% of foods as a source of potassium, with a 100g serving covering about 12% of the daily need for this mineral.
These nuts contain a moderate amount of choline and selenium.
Raw or unsalted roasted pecans have no sodium. However, dry-roasted or oil-roasted pecans with added salt are very high in sodium, providing 383mg per 100g serving.
Pecans are also a good source of the trace mineral molybdenum.
Mineral coverage chart
Pecans have a moderate iodine content, with 2mcg per ¼ cup serving size. Iodine is primarily used in the production of thyroid hormones. The thyroid helps regulate the rate at which your body burns energy. It also aids growth, development, body temperature regulation, and nerve function. Iodine is only required in trace amounts. Your health may suffer in the long run if you do not consume enough iodine (10).
Phytochemicals
Total phytosterols
Pecans have many phytosterols, including stigmasterol, campesterol, and b-sitosterol. The levels of phytosterols in these nuts may be sufficient to play a synergistic role with unsaturated fatty acids in helping to maintain normal cholesterol levels (11). Several studies have demonstrated a dose-response reduction of cholesterol mediated by phytosterols, even at lower levels similar to those found in plant-based diets with pecans.
Sterols
According to research, pecans contain 95mg of plant sterols per 100 grams, particularly beta-sitosterol. Because beta-sitosterol competes with cholesterol absorption in the body, it can lower blood cholesterol levels. Eating 34 cups of pecans daily has been shown to significantly reduce total and LDL ("bad") cholesterol levels (12).
Phenols
Pecans are rich sources of phenols, including anthocyanins, flavonoids, proanthocyanidins, flavonols, and isoflavones. These compounds have potent antioxidant effects. Phenolic compounds are associated with a protective effect against diseases related to free radical overproduction, such as cardiovascular disease and cancer (13).
Carotenoids
Pecans contain a high amount of carotenoids, especially lutein and zeaxanthin. Carotenoids are a class of phytonutrients responsible for pecans' natural color. Carotenoids have potent antioxidant properties and have been associated with a reduced risk of cardiovascular disease and some types of cancer (14).
Glycemic Index
Due to the relatively low level of carbohydrates, the glycemic index of pecan is said to be 10. These nuts are considered low glycemic index foods (15).
You can also visit our Glycemic index chart page for glycemic index values of 350+ pages.
Acidity
Pecans are acidic. The pH value of pecans falls in the range of 2.1 to 2.5.
Comparison of Similar Foods
We compared pecans to other nuts in our database and highlighted which contains more macronutrients.
Compared to peanuts, pecans contain less sodium, sugar, and saturated fats.
Regarding chestnuts, pecans contain more vitamins, minerals, fats, and less sodium.
Pecans have more vitamins B1 and B5, vitamins E and A, magnesium, and zinc than walnuts and cashews.
Moreover, pecans win hands down in fat and fiber content compared to walnuts.
Here again, pecans win in comparison with almonds. They are higher in carbs and richer in polyunsaturated (omega-3 omega-6) and monounsaturated fats. Besides, pecans have more zinc, copper, and vitamins B1, B5, B6, and K.
References
- https://fdc.nal.usda.gov/fdc-app.html#/food-details/170182/nutrients
- https://fdc.nal.usda.gov/fdc-app.html#/food-details/170183/nutrients
- https://fdc.nal.usda.gov/fdc-app.html#/food-details/169424/nutrients
- https://fdc.nal.usda.gov/fdc-app.html#/food-details/170589/nutrients
- https://fdc.nal.usda.gov/fdc-app.html#/food-details/169425/nutrients
- https://www.ncbi.nlm.nih.gov/pmc/articles/PMC5827884/
- https://cardiab.biomedcentral.com/articles/10.1186/s12933-015-0237-9
- https://www.ncbi.nlm.nih.gov/pmc/articles/PMC7469037/
- https://www.sciencedirect.com/science/article/abs/pii/S0271531706001278
- https://www.ibdcentrebc.ca/wp-content/uploads/Food-Sources-of-Iodine.pdf
- https://pubmed.ncbi.nlm.nih.gov/26148925/
- https://www.researchgate.net/publication/51707596
- https://www.sciencedirect.com/science/article/pii/S0963996919306040
- https://pubmed.ncbi.nlm.nih.gov/33801608/
- https://foodstruct.com/pdf/GI-News-December-2015-Sydney-University.pdf

Top nutrition facts for Pecan
|
Glycemic index ⓘ
Source:
Check out our Glycemic index chart page for the full list.
|
10 (low) |
| Glycemic load ⓘ Glycemic Load (GL) is a metric that measures both the quality (Glycemic Index) and quantity of carbohydrates in a specific serving of food to estimate its impact on blood sugar levels. It is calculated as: (GI × Carbs in grams) / 100. | 0 (low) |
| Default serving size ⓘ Serving sizes are mostly taken from FDA's Reference Amounts Customarily Consumed (RACCs) | 1 oz (19 halves) (28.35 g) |
| Acidity (Based on PRAL) ⓘ PRAL (Potential renal acid load) is calculated using a formula. On the PRAL scale the higher the positive value, the more is the acidifying effect on the body. The lower the negative value, the higher the alkalinity of the food. 0 is neutral. | 2.1 (acidic) |
| Oxalates | 37 mg ⓘ https://www.sciencedirect.com/science/article/abs/pii/S0889157513000902 |
| Net carbs ⓘ Net Carbs = Total Carbohydrates – Fiber – Sugar Alcohols | 4 g |
| Calories ⓘ Calories for selected serving | 691 kcal |
| Tannins | 6.94 mg ⓘ https://www.frontiersin.org/journals/nutrition/articles/10.3389/fnut.2022.868054/full www.list.am |
Pecan calories (kcal)
| Calories for different serving sizes of pecan | Calories | Weight |
|---|---|---|
| Calories in 100 grams | 691 | |
| Calories in 1 cup, halves | 684 | 99 g |
| Calories in 1 cup, chopped | 753 | 109 g |
| Calories for different varieties of pecan | Calories | Weight |
|---|---|---|
| Nuts, pecans (this food) | 691 | 100 g |
| Nuts, pecans, dry roasted, without salt added | 710 | 100 g |
| Nuts, pecans, dry roasted, with salt added | 710 | 100 g |
| Nuts, pecans, oil roasted, without salt added | 715 | 100 g |
| Nuts, pecans, oil roasted, with salt added | 715 | 100 g |
Extra Nutrition facts for Pecan
| Processing score ⓘ The processing score is a calculated value that looks at both how industrially made it is (NOVA) and how healthy/unprocessed the ingredients are (SIGA), then combines them into one score from 1 (least processed) to 4 (most processed). | 1 - Unprocessed ⓘ NOVA score = 1, SIGA score = A0 |
| Protein per 100 calories ⓘ Shows how many grams of protein you get from 100 calories of this food, calculated as (protein in g ÷ calories) × 100. | 1.3 g |
| Stigmasterol | 3 mg |
| Calories per 10 g protein ⓘ Shows how many calories you need to eat from this food to get 10 g of protein, calculated as (calories ÷ protein in g) × 10. | 754 kcal |
| Weight per 100 calories ⓘ Shows how many grams of this food equal 100 kcal—higher grams mean a larger portion for the same calories. | 14 g |
| Unsaturated / Saturated Fat ratio ⓘ (monounsaturated + polyunsaturated) / saturated, ≥2 broadly recommended by major guidelines for heart health | 10 |
| Campesterol ⓘ https://fdc.nal.usda.gov/food-details/170182/nutrients | 6 mg ⓘ https://fdc.nal.usda.gov/food-details/170182/nutrients |
| Beta-sitosterol ⓘ Beta-sitosterol is a naturally occurring plant sterol (phytosterol) that is structurally similar to cholesterol. It is found in various plant-based foods and is commonly used in supplements, primarily for lowering cholesterol levels and improving symptoms of an enlarged prostate (BPH). | 117 mg ⓘ https://fdc.nal.usda.gov/food-details/170182/nutrients |
| Fluoride | 10 mcg ⓘ https://fdc.nal.usda.gov/food-details/170182/nutrients |
| Saponin | 490 mg ⓘ https://www.researchgate.net/profile/Ankit-Goyal-22/publication/346627882 |
| Alkaloids | 260 mg ⓘ https://www.researchgate.net/profile/Ankit-Goyal-22/publication/346627882 |
| Phytic acid | 855 mg ⓘ https://www.researchgate.net/profile/Ankit-Goyal-22/publication/346627882 |
| Flavonoids | 45 mg ⓘ https://www.researchgate.net/profile/Ankit-Goyal-22/publication/346627882 |
Pecan Glycemic index (GI)
Mineral chart - relative view
Vitamin chart - relative view
All nutrients for Pecan per 100g
| Nutrient | Value | DV% | In TOP % of foods | Comparison |
| Vitamin A | 3µg | 0% | 45% | |
| Calories | 691kcal | 35% | 2% |
14.7 times more than Orange
|
| Protein per 100 calories | 1.3g | N/A | 81% | |
| Calories per 10 g protein | 754kcal | N/A | 16% | |
| Weight per 100 calories | 14g | N/A | 98% | |
| Protein | 9.2g | 22% | 47% |
3.3 times more than Broccoli
|
| Unsaturated / Saturated Fat ratio | 10 | N/A | 2% | |
| Fats | 72g | 111% | 2% |
2.2 times more than Cheese
|
| Vitamin C | 1.1mg | 1% | 32% |
48.2 times less than Lemon
|
| Net carbs | 4.3g | N/A | 59% |
12.7 times less than Chocolate
|
| Carbs | 14g | 5% | 43% |
2 times less than Rice
|
| Cholesterol | 0mg | 0% | 100% |
N/A
|
| Vitamin D* | 0 IU | 0% | 100% |
N/A
|
| Vitamin D | 0µg | 0% | 100% |
N/A
|
| Magnesium | 121mg | 29% | 5% |
1.2 times less than Almonds
|
| Calcium | 70mg | 7% | 24% |
1.8 times less than Milk
|
| Potassium | 410mg | 12% | 13% |
2.8 times more than Cucumber
|
| Iron | 2.5mg | 32% | 26% |
Equal to Beef broiled
|
| Sugar | 4g | N/A | 31% |
2.3 times less than Coca-Cola
|
| Fiber | 9.6g | 38% | 5% |
4 times more than Orange
|
| Copper | 1.2mg | 133% | 2% |
8.5 times more than Shiitake
|
| Zinc | 4.5mg | 41% | 13% |
1.4 times less than Beef broiled
|
| Starch | 0.46g | 0% | 10% |
33.2 times less than Potato
|
| Phosphorus | 277mg | 40% | 13% |
1.5 times more than Chicken meat
|
| Sodium | 0mg | 0% | 100% |
N/A
|
| Vitamin E | 1.4mg | 9% | 10% |
Equal to Kiwi
|
| Manganese | 4.5mg | 196% | 2% | |
| Selenium | 3.8µg | 7% | 51% | |
| Vitamin B1 | 0.66mg | 55% | 7% |
2.5 times more than Pea raw
|
| Vitamin B2 | 0.13mg | 10% | 56% |
Equal to Avocado
|
| Vitamin B3 | 1.2mg | 7% | 60% |
8.2 times less than Turkey meat
|
| Vitamin B5 | 0.86mg | 17% | 14% |
1.3 times less than Sunflower seeds
|
| Vitamin B6 | 0.21mg | 16% | 38% |
1.8 times more than Oats
|
| Vitamin B12 | 0µg | 0% | 100% |
N/A
|
| Vitamin K | 3.5µg | 3% | 19% |
29 times less than Broccoli
|
| Folate | 22µg | 6% | 33% |
2.8 times less than Brussels sprouts
|
| Choline | 41mg | 7% | 22% | |
| Saturated fat | 6.2g | 31% | 17% |
Equal to Beef broiled
|
| Monounsaturated fat | 41g | N/A | 1% |
4.2 times more than Avocado
|
| Polyunsaturated fat | 22g | N/A | 2% |
2.2 times less than Walnut
|
| Tryptophan | 0.09mg | 0% | 38% |
3.3 times less than Chicken meat
|
| Threonine | 0.31mg | 0% | 37% |
2.4 times less than Beef broiled
|
| Isoleucine | 0.34mg | 0% | 38% |
2.7 times less than Salmon raw
|
| Leucine | 0.6mg | 0% | 39% |
4.1 times less than Tuna Bluefin
|
| Lysine | 0.29mg | 0% | 41% |
1.6 times less than Tofu
|
| Methionine | 0.18mg | 0% | 36% |
1.9 times more than Quinoa
|
| Phenylalanine | 0.43mg | 0% | 37% |
1.6 times less than Egg
|
| Valine | 0.41mg | 0% | 38% |
4.9 times less than Soybean raw
|
| Histidine | 0.26mg | 0% | 35% |
2.9 times less than Turkey meat
|
| Fructose | 0.04g | 0% | 13% |
147.5 times less than Apple
|
| Caffeine | 0mg | 0% | 100% | |
| Omega-3 - EPA | 0g | N/A | 100% |
N/A
|
| Omega-3 - DHA | 0g | N/A | 100% |
N/A
|
| Omega-3 - DPA | 0g | N/A | 100% |
N/A
|
| Omega-6 - Eicosadienoic acid | 0g | N/A | 100% |
Check out similar food or compare with current
NUTRITION FACTS LABEL
Serving Size ______________
Health checks
Pecan nutrition infographic
References
All the values for which the sources are not specified explicitly are taken from FDA’s Food Central. The exact link to the food presented on this page can be found below.