Penne vs. Taco — In-Depth Nutrition Comparison
Compare
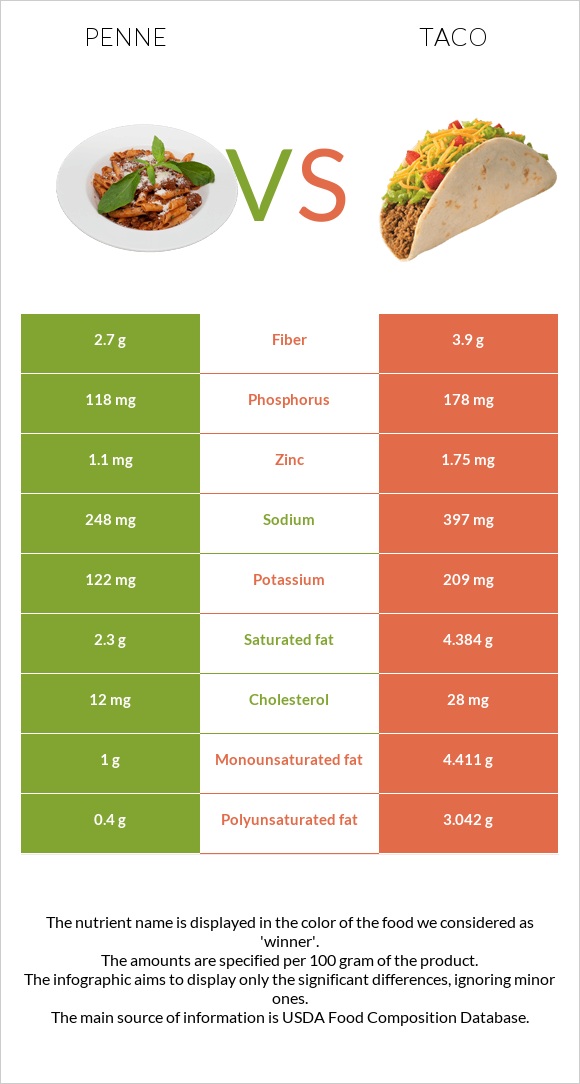
How are penne and taco different?
- Taco is higher than penne in phosphorus, zinc, monounsaturated fat, and polyunsaturated fat.
- Penne is lower in sodium.
KASHI Three Cheese Penne, frozen, unprepared and Fast foods, taco with beef, cheese, and lettuce, hard shell types were used in this article.
Infographic
Infographic link
Mineral Comparison
Mineral comparison score is based on the number of minerals by which one or the other food is richer. The "coverage" charts below show how much of the daily needs can be covered by 300 grams of the food.
| Contains less SodiumSodium | -37.5% |
| Contains more PotassiumPotassium | +71.3% |
| Contains more IronIron | +48.8% |
| Contains more ZincZinc | +59.1% |
| Contains more PhosphorusPhosphorus | +50.8% |
Vitamin Comparison
Vitamin comparison score is based on the number of vitamins by which one or the other food is richer. The "coverage" charts below show how much of the daily needs can be covered by 300 grams of the food.
| Contains more Vitamin CVitamin C | +∞% |
| Contains more Vitamin DVitamin D | +∞% |
All nutrients comparison - raw data values
| Nutrient |  |
 |
DV% diff. |
| Vitamin B12 | 0.93µg | 39% | |
| Polyunsaturated fat | 0.4g | 3.042g | 18% |
| Selenium | 9.2µg | 17% | |
| Fats | 4g | 12.7g | 13% |
| Vitamin K | 15.3µg | 13% | |
| Manganese | 0.249mg | 11% | |
| Vitamin B3 | 1.65mg | 10% | |
| Copper | 0.077mg | 9% | |
| Phosphorus | 118mg | 178mg | 9% |
| Saturated fat | 2.3g | 4.384g | 9% |
| Monounsaturated fat | 1g | 4.411g | 9% |
| Vitamin B6 | 0.09mg | 7% | |
| Protein | 5.7g | 8.86g | 6% |
| Zinc | 1.1mg | 1.75mg | 6% |
| Starch | 14.78g | 6% | |
| Sodium | 248mg | 397mg | 6% |
| Choline | 32mg | 6% | |
| Calories | 126kcal | 226kcal | 5% |
| Cholesterol | 12mg | 28mg | 5% |
| Iron | 0.8mg | 1.19mg | 5% |
| Fiber | 2.7g | 3.9g | 5% |
| Vitamin B2 | 0.06mg | 5% | |
| Folate | 19µg | 5% | |
| Vitamin E | 0.6mg | 4% | |
| Vitamin B1 | 0.05mg | 4% | |
| Potassium | 122mg | 209mg | 3% |
| Vitamin A | 20µg | 2% | |
| Carbs | 16.8g | 19.85g | 1% |
| Vitamin D | 0 IU | 4 IU | 1% |
| Vitamin D | 0µg | 0.1µg | 1% |
| Vitamin C | 0mg | 0.4mg | 0% |
| Net carbs | 14.1g | 15.95g | N/A |
| Magnesium | 30mg | 32mg | 0% |
| Calcium | 89mg | 89mg | 0% |
| Sugar | 1.9g | 0.9g | N/A |
| Trans fat | 0.2g | 0.467g | N/A |
| Fructose | 0.3g | 0% | |
| Omega-3 - EPA | 0.005g | N/A | |
| Omega-3 - ALA | 0.166g | N/A | |
| Omega-3 - DPA | 0.006g | N/A | |
| Omega-3 - Eicosatrienoic acid | 0.001g | N/A | |
| Omega-6 - Gamma-linoleic acid | 0.002g | N/A | |
| Omega-6 - Dihomo-gamma-linoleic acid | 0.011g | N/A | |
| Omega-6 - Eicosadienoic acid | 0.004g | N/A | |
| Omega-6 - Linoleic acid | 2.708g | N/A |
Macronutrient Comparison
Macronutrient breakdown side-by-side comparison
| Contains more WaterWater | +27% |
| Contains more ProteinProtein | +55.4% |
| Contains more FatsFats | +217.5% |
| Contains more CarbsCarbs | +18.2% |
| Contains more OtherOther | +42.7% |
Fat Type Comparison
Fat type breakdown side-by-side comparison
| Contains less Sat. FatSaturated fat | -47.5% |
| Contains more Mono. FatMonounsaturated fat | +341.1% |
| Contains more Poly. FatPolyunsaturated fat | +660.5% |


