Peruvian groundcherry vs. Crab — In-Depth Nutrition Comparison
Compare
How are Peruvian groundcherry and crab different?
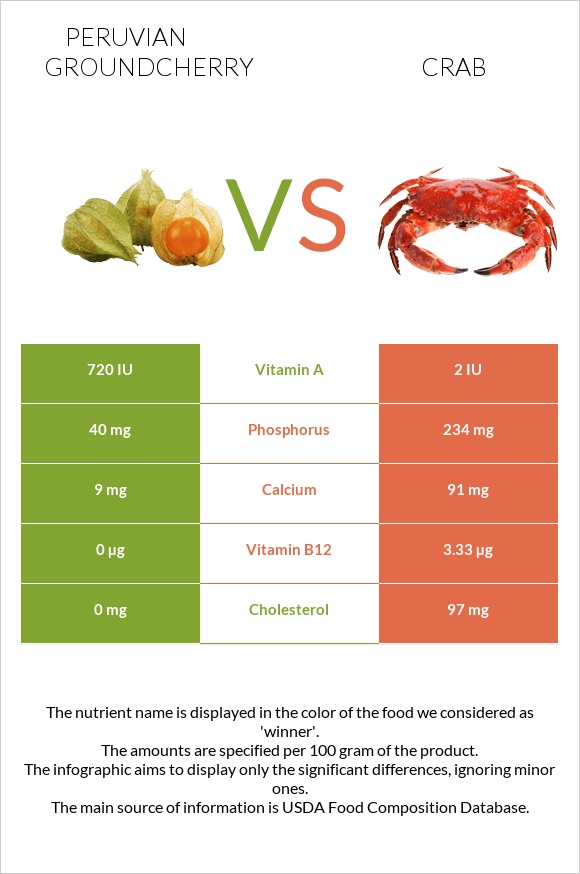
- Peruvian groundcherry is higher in vitamin A, vitamin C, vitamin B1, and iron; however, crab is richer in vitamin B12, phosphorus, and calcium.
- Daily need coverage for vitamin B12 for crab is 139% higher.
- Peruvian groundcherry contains 360 times more vitamin A than crab. While Peruvian groundcherry contains 720 IU of vitamin A, crab contains only 2 IU.
- Crab has a lower glycemic index (0) than Peruvian groundcherry (35).
Groundcherries, (cape-gooseberries or poha), raw and Crustaceans, crab, blue, canned are the varieties used in this article.
Infographic
Infographic link
Mineral Comparison
Mineral comparison score is based on the number of minerals by which one or the other food is richer. The "coverage" charts below show how much of the daily needs can be covered by 300 grams of the food.
| Contains more IronIron | +100% |
| Contains less SodiumSodium | -100% |
| Contains more CalciumCalcium | +911.1% |
| Contains more PhosphorusPhosphorus | +485% |
Vitamin Comparison
Vitamin comparison score is based on the number of vitamins by which one or the other food is richer. The "coverage" charts below show how much of the daily needs can be covered by 300 grams of the food.
| Contains more Vitamin CVitamin C | +233.3% |
| Contains more Vitamin AVitamin A | +3500% |
| Contains more Vitamin B1Vitamin B1 | +378.3% |
| Contains more Vitamin B2Vitamin B2 | +132.5% |
| Contains more Vitamin B12Vitamin B12 | +∞% |
All nutrients comparison - raw data values
| Nutrient |  |
 |
DV% diff. |
| Vitamin B12 | 0µg | 3.33µg | 139% |
| Copper | 0.814mg | 90% | |
| Selenium | 42.9µg | 78% | |
| Zinc | 3.81mg | 35% | |
| Protein | 1.9g | 17.88g | 32% |
| Cholesterol | 0mg | 97mg | 32% |
| Phosphorus | 40mg | 234mg | 28% |
| Sodium | 563mg | 24% | |
| Vitamin B5 | 0.997mg | 20% | |
| Choline | 80.9mg | 15% | |
| Folate | 51µg | 13% | |
| Vitamin E | 1.84mg | 12% | |
| Vitamin B6 | 0.156mg | 12% | |
| Vitamin C | 11mg | 3.3mg | 9% |
| Magnesium | 36mg | 9% | |
| Calcium | 9mg | 91mg | 8% |
| Potassium | 259mg | 8% | |
| Vitamin B1 | 0.11mg | 0.023mg | 7% |
| Iron | 1mg | 0.5mg | 6% |
| Carbs | 11.2g | 0g | 4% |
| Vitamin A | 36µg | 1µg | 4% |
| Vitamin B2 | 0.04mg | 0.093mg | 4% |
| Manganese | 0.074mg | 3% | |
| Calories | 53kcal | 83kcal | 2% |
| Polyunsaturated fat | 0.258g | 2% | |
| Saturated fat | 0.201g | 1% | |
| Fats | 0.7g | 0.74g | 0% |
| Net carbs | 11.2g | 0g | N/A |
| Vitamin B3 | 2.8mg | 2.747mg | 0% |
| Vitamin K | 0.3µg | 0% | |
| Trans fat | 0g | 0.014g | N/A |
| Monounsaturated fat | 0.129g | 0% | |
| Tryptophan | 0.226mg | 0% | |
| Threonine | 0.727mg | 0% | |
| Isoleucine | 0.776mg | 0% | |
| Leucine | 1.307mg | 0% | |
| Lysine | 1.386mg | 0% | |
| Methionine | 0.452mg | 0% | |
| Phenylalanine | 0.708mg | 0% | |
| Valine | 0.806mg | 0% | |
| Histidine | 0.393mg | 0% | |
| Omega-3 - EPA | 0.101g | N/A | |
| Omega-3 - DHA | 0.067g | N/A | |
| Omega-3 - DPA | 0.009g | N/A | |
| Omega-6 - Eicosadienoic acid | 0.005g | N/A |
Macronutrient Comparison
Macronutrient breakdown side-by-side comparison
Protein:
1.9 g
Fats:
0.7 g
Carbs:
11.2 g
Water:
85.4 g
Other:
0.8 g
Protein:
17.88 g
Fats:
0.74 g
Carbs:
0 g
Water:
79.69 g
Other:
1.69 g
| Contains more CarbsCarbs | +∞% |
| Contains more ProteinProtein | +841.1% |
| Contains more OtherOther | +111.3% |
~equal in
Fats
~0.74g
~equal in
Water
~79.69g


