Picante sauce vs. Chicken rice soup — In-Depth Nutrition Comparison
Compare
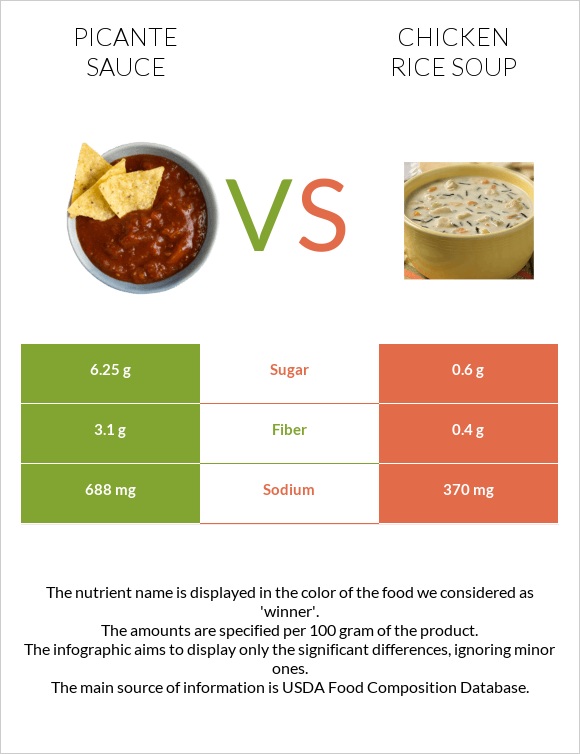
The main differences between picante sauce and chicken rice soup
- Picante sauce has more fiber; however, chicken rice soup has more vitamin A.
- Daily need coverage for vitamin A for chicken rice soup is 36% higher.
- Chicken rice soup has 10 times less sugar than picante sauce. Picante sauce has 6.25g of sugar, while chicken rice soup has 0.6g.
Food types used in this article are PACE, Organic Picante Sauce and Soup, chicken rice, canned, chunky, ready-to-serve.
Infographic
Infographic link
Mineral Comparison
Mineral comparison score is based on the number of minerals by which one or the other food is richer. The "coverage" charts below show how much of the daily needs can be covered by 300 grams of the food.
| Contains less SodiumSodium | -46.2% |
Vitamin Comparison
Vitamin comparison score is based on the number of vitamins by which one or the other food is richer. The "coverage" charts below show how much of the daily needs can be covered by 300 grams of the food.
All nutrients comparison - raw data values
| Nutrient |  |
 |
DV% diff. |
| Sodium | 688mg | 370mg | 14% |
| Vitamin A | 122µg | 14% | |
| Fiber | 3.1g | 0.4g | 11% |
| Copper | 0.1mg | 11% | |
| Vitamin B3 | 1.71mg | 11% | |
| Protein | 0g | 5.11g | 10% |
| Iron | 0.78mg | 10% | |
| Selenium | 4.5µg | 8% | |
| Vitamin K | 7.2µg | 6% | |
| Vitamin B12 | 0.13µg | 5% | |
| Zinc | 0.4mg | 4% | |
| Phosphorus | 30mg | 4% | |
| Manganese | 0.1mg | 4% | |
| Vitamin B2 | 0.041mg | 3% | |
| Vitamin B5 | 0.15mg | 3% | |
| Fats | 0g | 1.33g | 2% |
| Vitamin C | 1.6mg | 2% | |
| Cholesterol | 0mg | 5mg | 2% |
| Vitamin E | 0.24mg | 2% | |
| Vitamin B6 | 0.02mg | 2% | |
| Saturated fat | 0g | 0.4g | 2% |
| Monounsaturated fat | 0.6g | 2% | |
| Polyunsaturated fat | 0.28g | 2% | |
| Calories | 25kcal | 53kcal | 1% |
| Magnesium | 4mg | 1% | |
| Calcium | 14mg | 1% | |
| Potassium | 45mg | 1% | |
| Vitamin B1 | 0.01mg | 1% | |
| Folate | 2µg | 1% | |
| Choline | 4.9mg | 1% | |
| Protein per 100 calories | 0g | 9.6g | N/A |
| Calories per 10 g protein | 104kcal | N/A | |
| Weight per 100 calories | 400g | 189g | N/A |
| Net carbs | 3.15g | 5.01g | N/A |
| Carbs | 6.25g | 5.41g | 0% |
| Sugar | 6.25g | 0.6g | N/A |
Macronutrient Comparison
Macronutrient breakdown side-by-side comparison
Protein:
0 g
Fats:
0 g
Carbs:
6.25 g
Water:
89.3 g
Other:
4.45 g
Protein:
5.11 g
Fats:
1.33 g
Carbs:
5.41 g
Water:
86.78 g
Other:
1.37 g
| Contains more CarbsCarbs | +15.5% |
| Contains more OtherOther | +224.8% |
| Contains more ProteinProtein | +∞% |
| Contains more FatsFats | +∞% |
~equal in
Water
~86.78g


