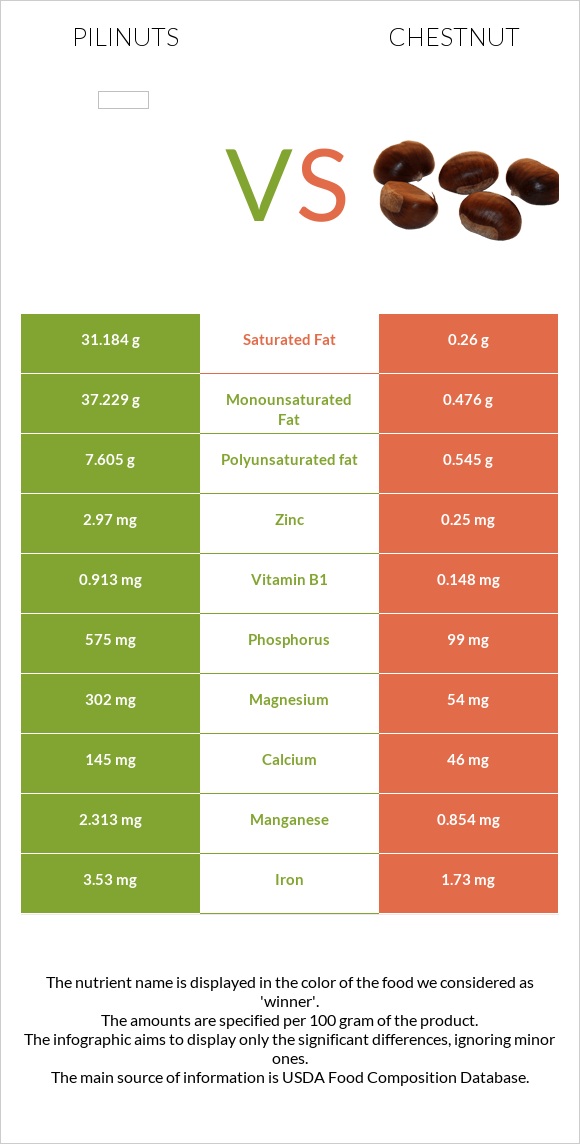
What are the main differences between pili nuts and chestnut? Pili nuts are richer in phosphorus, vitamin B1, manganese, magnesium, copper, zinc, iron, and calcium, yet chestnut is richer in vitamin C. Pili nuts' daily need coverage for saturated fat is 155% higher. Pili nuts have 12 times more zinc than chestnut. Pili nuts have 2.97mg of zinc, while chestnut has 0.25mg. Chestnut contains less saturated fat. We used Nuts, pilinuts, dried and Nuts, chestnuts, european, boiled, and steamed types in this comparison.
Infographic
Mineral Comparison
Mineral comparison score is based on the number of minerals by which one or the other food is richer. The "coverage" charts below show how much of the daily needs can be covered by 300 grams of the food.
8
100 g
300 g
1 oz (15 kernels) - 28.35g 1 cup - 120g
Magnesium
Magnesium
Calcium
Calcium
Potassium
Potassium
Iron
Iron
Copper
Copper
Zinc
Zinc
Phosphorus
Phosphorus
Sodium
Sodium
Manganese
Manganese
Selenium
Selenium
216%
44%
45%
132%
319%
81%
246%
0.39%
302%
0%
1
100 g
300 g
1 oz - 28.35g
Magnesium
Magnesium
Calcium
Calcium
Potassium
Potassium
Iron
Iron
Copper
Copper
Zinc
Zinc
Phosphorus
Phosphorus
Sodium
Sodium
Manganese
Manganese
Selenium
Selenium
39%
14%
63%
65%
157%
6.8%
42%
3.5%
111%
0%
Vitamin Comparison
Vitamin comparison score is based on the number of vitamins by which one or the other food is richer. The "coverage" charts below show how much of the daily needs can be covered by 300 grams of the food.
4
100 g
300 g
1 oz (15 kernels) - 28.35g 1 cup - 120g
Vitamin C
Vit. C
Vitamin D
Vit. D
Vitamin A
Vit. A
Vitamin E
Vit. E
Vitamin B1
Vit. B1
Vitamin B2
Vit. B2
Vitamin B3
Vit. B3
Vitamin B5
Vit. B5
Vitamin B6
Vit. B6
Vitamin B12
Vit. B12
Vitamin K
Vit. K
Folate
Folate
2%
0%
0.67%
0%
228%
21%
9.7%
29%
27%
0%
0%
45%
4
100 g
300 g
1 oz - 28.35g
Vitamin C
Vit. C
Vitamin D
Vit. D
Vitamin A
Vit. A
Vitamin E
Vit. E
Vitamin B1
Vit. B1
Vitamin B2
Vit. B2
Vitamin B3
Vit. B3
Vitamin B5
Vit. B5
Vitamin B6
Vit. B6
Vitamin B12
Vit. B12
Vitamin K
Vit. K
Folate
Folate
89%
0%
0.33%
0%
37%
24%
14%
19%
54%
0%
0%
29%
All nutrients comparison - raw data values
Nutrient
DV% diff.
Saturated fat
31.184g
0.26g
141%
Fats
79.55g
1.38g
120%
Monounsaturated fat
37.229g
0.476g
92%
Phosphorus
575mg
99mg
68%
Vitamin B1
0.913mg
0.148mg
64%
Manganese
2.313mg
0.854mg
63%
Magnesium
302mg
54mg
59%
Copper
0.958mg
0.472mg
54%
Polyunsaturated fat
7.605g
0.545g
47%
Calories
719kcal
131kcal
29%
Vitamin C
0.6mg
26.7mg
29%
Zinc
2.97mg
0.25mg
25%
Iron
3.53mg
1.73mg
23%
Protein
10.8g
2g
18%
Calcium
145mg
46mg
10%
Vitamin B6
0.115mg
0.233mg
9%
Carbs
3.98g
27.76g
8%
Potassium
507mg
715mg
6%
Folate
60µg
38µg
6%
Vitamin B5
0.479mg
0.316mg
3%
Sodium
3mg
27mg
1%
Vitamin B2
0.093mg
0.104mg
1%
Vitamin B3
0.519mg
0.731mg
1%
Protein per 100 calories
1.5g
1.5g
N/A
Calories per 10 g protein
666kcal
655kcal
N/A
Weight per 100 calories
14g
76g
N/A
Unsaturated / Saturated Fat ratio
1.4
3.9
N/A
Net carbs
3.98g
27.76g
N/A
Vitamin A
2µg
1µg
0%
Tryptophan
0.189mg
0.022mg
0%
Threonine
0.407mg
0.071mg
0%
Isoleucine
0.483mg
0.079mg
0%
Leucine
0.89mg
0.118mg
0%
Lysine
0.369mg
0.118mg
0%
Methionine
0.395mg
0.047mg
0%
Phenylalanine
0.497mg
0.084mg
0%
Valine
0.701mg
0.112mg
0%
Histidine
0.255mg
0.055mg
0%
Macronutrient Comparison
Macronutrient breakdown side-by-side comparison
3
11%
80%
4%
3%
3%
Protein:
10.8 g
Fats:
79.55 g
Carbs:
3.98 g
Water:
2.77 g
Other:
2.9 g
2
2%
28%
68%
Protein:
2 g
Fats:
1.38 g
Carbs:
27.76 g
Water:
68.15 g
Other:
0.71 g
Contains
more
Protein Protein
+440%
Contains
more
Fats Fats
+5664.5%
Contains
more
Other Other
+308.5%
Contains
more
Carbs Carbs
+597.5%
Contains
more
Water Water
+2360.3%
Fat Type Comparison
Fat type breakdown side-by-side comparison
2
41%
49%
10%
Saturated fat:
Sat. Fat
31.184 g
Monounsaturated fat:
Mono. Fat
37.229 g
Polyunsaturated fat:
Poly. Fat
7.605 g
1
20%
37%
43%
Saturated fat:
Sat. Fat
0.26 g
Monounsaturated fat:
Mono. Fat
0.476 g
Polyunsaturated fat:
Poly. Fat
0.545 g
Contains
more
Mono. Fat Monounsaturated fat
+7721.2%
Contains
more
Poly. Fat Polyunsaturated fat
+1295.4%
Contains
less
Sat. Fat Saturated fat
-99.2%