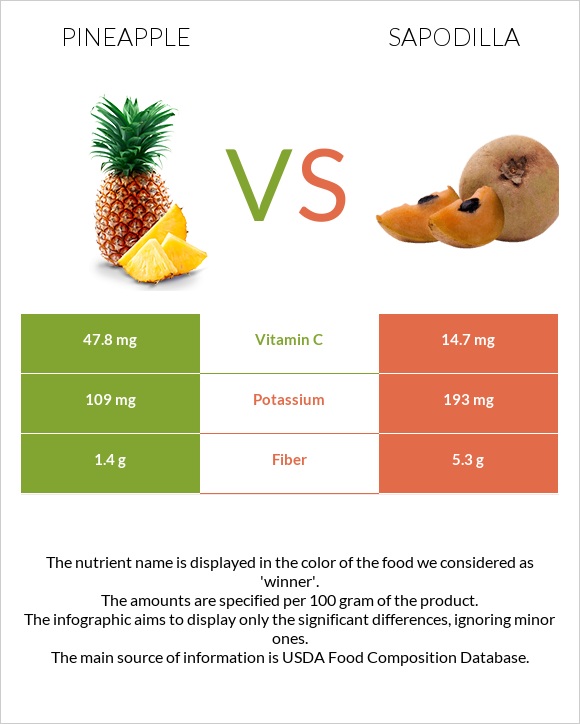
How are pineapple and sapodillas different? Pineapple is higher in vitamin C, vitamin B1, and vitamin B6; however, sapodillas are richer in fiber and iron. Daily need coverage for vitamin C for pineapple is 37% higher. Sapodillas have a lower glycemic index (37) than pineapple (66). Pineapple, raw, all varieties and Sapodilla, raw are the varieties used in this article.
Infographic
Mineral Comparison
Mineral comparison score is based on the number of minerals by which one or the other food is richer. The "coverage" charts below show how much of the daily needs can be covered by 300 grams of the food.
4
100 g
300 g
1 slice, thin (3-1/2" dia x 1/2" thick) - 56g 1 slice (3-1/2" dia x 3/4" thick) - 84g 1 cup, chunks - 165g 1 slice (4-2/3" dia x 3/4" thick) - 166g 1 fruit - 905g
Magnesium
Magnesium
Calcium
Calcium
Potassium
Potassium
Iron
Iron
Copper
Copper
Zinc
Zinc
Phosphorus
Phosphorus
Sodium
Sodium
Manganese
Manganese
Selenium
Selenium
8.6%
3.9%
9.6%
11%
37%
3.3%
3.4%
0.13%
121%
0.55%
5
100 g
300 g
1 sapodilla - 170g 1 cup, pulp - 241g
Magnesium
Magnesium
Calcium
Calcium
Potassium
Potassium
Iron
Iron
Copper
Copper
Zinc
Zinc
Phosphorus
Phosphorus
Sodium
Sodium
Manganese
Manganese
Selenium
Selenium
8.6%
6.3%
17%
30%
29%
2.7%
5.1%
1.6%
0%
3.3%
Vitamin Comparison
Vitamin comparison score is based on the number of vitamins by which one or the other food is richer. The "coverage" charts below show how much of the daily needs can be covered by 300 grams of the food.
8
100 g
300 g
1 slice, thin (3-1/2" dia x 1/2" thick) - 56g 1 slice (3-1/2" dia x 3/4" thick) - 84g 1 cup, chunks - 165g 1 slice (4-2/3" dia x 3/4" thick) - 166g 1 fruit - 905g
Vitamin C
Vit. C
Vitamin D
Vit. D
Vitamin A
Vit. A
Vitamin E
Vit. E
Vitamin B1
Vit. B1
Vitamin B2
Vit. B2
Vitamin B3
Vit. B3
Vitamin B5
Vit. B5
Vitamin B6
Vit. B6
Vitamin B12
Vit. B12
Vitamin K
Vit. K
Folate
Folate
159%
0%
1%
0.4%
20%
7.4%
9.4%
13%
26%
0%
1.8%
14%
1
100 g
300 g
1 sapodilla - 170g 1 cup, pulp - 241g
Vitamin C
Vit. C
Vitamin D
Vit. D
Vitamin A
Vit. A
Vitamin E
Vit. E
Vitamin B1
Vit. B1
Vitamin B2
Vit. B2
Vitamin B3
Vit. B3
Vitamin B5
Vit. B5
Vitamin B6
Vit. B6
Vitamin B12
Vit. B12
Vitamin K
Vit. K
Folate
Folate
49%
0%
1%
0%
0%
4.6%
3.8%
15%
8.5%
0%
0%
11%
All nutrients comparison - raw data values
Nutrient
DV% diff.
Manganese
0.927mg
40%
Vitamin C
47.8mg
14.7mg
37%
Fiber
1.4g
5.3g
16%
Vitamin B1
0.079mg
0mg
7%
Iron
0.29mg
0.8mg
6%
Vitamin B6
0.112mg
0.037mg
6%
Copper
0.11mg
0.086mg
3%
Fructose
2.12g
3%
Calories
50kcal
83kcal
2%
Fats
0.12g
1.1g
2%
Carbs
13.12g
19.96g
2%
Potassium
109mg
193mg
2%
Vitamin B3
0.5mg
0.2mg
2%
Calcium
13mg
21mg
1%
Phosphorus
8mg
12mg
1%
Selenium
0.1µg
0.6µg
1%
Vitamin B2
0.032mg
0.02mg
1%
Vitamin B5
0.213mg
0.252mg
1%
Vitamin K
0.7µg
1%
Folate
18µg
14µg
1%
Choline
5.5mg
1%
Saturated fat
0.009g
0.194g
1%
Monounsaturated fat
0.013g
0.521g
1%
Protein
0.54g
0.44g
0%
Protein per 100 calories
1.1g
0.53g
N/A
Calories per 10 g protein
926kcal
1886kcal
N/A
Weight per 100 calories
200g
120g
N/A
Net carbs
11.72g
14.66g
N/A
Magnesium
12mg
12mg
0%
Sugar
9.85g
N/A
Zinc
0.12mg
0.1mg
0%
Sodium
1mg
12mg
0%
Vitamin A
3µg
3µg
0%
Vitamin E
0.02mg
0%
Polyunsaturated fat
0.04g
0.011g
0%
Tryptophan
0.005mg
0.005mg
0%
Threonine
0.019mg
0.012mg
0%
Isoleucine
0.019mg
0.015mg
0%
Leucine
0.024mg
0.024mg
0%
Lysine
0.026mg
0.039mg
0%
Methionine
0.012mg
0.003mg
0%
Phenylalanine
0.021mg
0.013mg
0%
Valine
0.024mg
0.016mg
0%
Histidine
0.01mg
0.016mg
0%
Macronutrient Comparison
Macronutrient breakdown side-by-side comparison
2
13%
86%
Protein:
0.54 g
Fats:
0.12 g
Carbs:
13.12 g
Water:
86 g
Other:
0.22 g
3
20%
78%
Protein:
0.44 g
Fats:
1.1 g
Carbs:
19.96 g
Water:
78 g
Other:
0.5 g
Contains
more
Protein Protein
+22.7%
Contains
more
Fats Fats
+816.7%
Contains
more
Carbs Carbs
+52.1%
Contains
more
Other Other
+127.3%
Fat Type Comparison
Fat type breakdown side-by-side comparison
2
15%
21%
65%
Saturated fat:
Sat. Fat
0.009 g
Monounsaturated fat:
Mono. Fat
0.013 g
Polyunsaturated fat:
Poly. Fat
0.04 g
1
27%
72%
Saturated fat:
Sat. Fat
0.194 g
Monounsaturated fat:
Mono. Fat
0.521 g
Polyunsaturated fat:
Poly. Fat
0.011 g
Contains
less
Sat. Fat Saturated fat
-95.4%
Contains
more
Poly. Fat Polyunsaturated fat
+263.6%
Contains
more
Mono. Fat Monounsaturated fat
+3907.7%