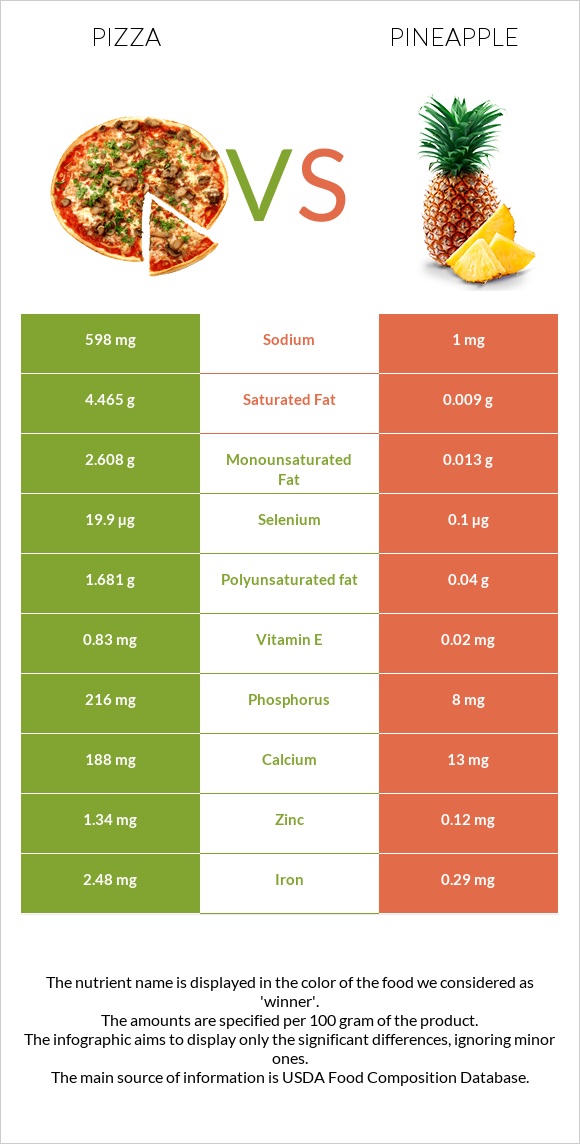
A recap on the differences between pizza and pineapple Pizza is higher in selenium, phosphorus, iron, vitamin B1, vitamin B3, and folate, yet pineapple is higher in vitamin C and manganese. Pineapple covers your daily vitamin C needs 52% more than pizza. Pizza contains 598 times more sodium than pineapple. While pizza contains 598mg of sodium, pineapple contains only 1mg. Food varieties used in this article are Fast Food, Pizza Chain, 14" pizza, cheese topping, regular crust and Pineapple, raw, all varieties .
Infographic
Mineral Comparison
Mineral comparison score is based on the number of minerals by which one or the other food is richer. The "coverage" charts below show how much of the daily needs can be covered by 300 grams of the food.
7
100 g
300 g
1 slice - 107g 1 pizza - 853g
Magnesium
Magnesium
Calcium
Calcium
Potassium
Potassium
Iron
Iron
Copper
Copper
Zinc
Zinc
Phosphorus
Phosphorus
Sodium
Sodium
Manganese
Manganese
Selenium
Selenium
17%
56%
15%
93%
35%
37%
93%
78%
47%
109%
2
100 g
300 g
1 slice, thin (3-1/2" dia x 1/2" thick) - 56g 1 slice (3-1/2" dia x 3/4" thick) - 84g 1 cup, chunks - 165g 1 slice (4-2/3" dia x 3/4" thick) - 166g 1 fruit - 905g
Magnesium
Magnesium
Calcium
Calcium
Potassium
Potassium
Iron
Iron
Copper
Copper
Zinc
Zinc
Phosphorus
Phosphorus
Sodium
Sodium
Manganese
Manganese
Selenium
Selenium
8.6%
3.9%
9.6%
11%
37%
3.3%
3.4%
0.13%
121%
0.55%
Vitamin Comparison
Vitamin comparison score is based on the number of vitamins by which one or the other food is richer. The "coverage" charts below show how much of the daily needs can be covered by 300 grams of the food.
8
100 g
300 g
1 slice - 107g 1 pizza - 853g
Vitamin C
Vit. C
Vitamin D
Vit. D
Vitamin A
Vit. A
Vitamin E
Vit. E
Vitamin B1
Vit. B1
Vitamin B2
Vit. B2
Vitamin B3
Vit. B3
Vitamin B5
Vit. B5
Vitamin B6
Vit. B6
Vitamin B12
Vit. B12
Vitamin K
Vit. K
Folate
Folate
4.7%
0%
23%
17%
98%
45%
72%
0%
18%
53%
17%
70%
3
100 g
300 g
1 slice, thin (3-1/2" dia x 1/2" thick) - 56g 1 slice (3-1/2" dia x 3/4" thick) - 84g 1 cup, chunks - 165g 1 slice (4-2/3" dia x 3/4" thick) - 166g 1 fruit - 905g
Vitamin C
Vit. C
Vitamin D
Vit. D
Vitamin A
Vit. A
Vitamin E
Vit. E
Vitamin B1
Vit. B1
Vitamin B2
Vit. B2
Vitamin B3
Vit. B3
Vitamin B5
Vit. B5
Vitamin B6
Vit. B6
Vitamin B12
Vit. B12
Vitamin K
Vit. K
Folate
Folate
159%
0%
1%
0.4%
20%
7.4%
9.4%
13%
26%
0%
1.8%
14%
All nutrients comparison - raw data values
Nutrient
DV% diff.
Vitamin C
1.4mg
47.8mg
52%
Selenium
19.9µg
0.1µg
36%
Phosphorus
216mg
8mg
30%
Iron
2.48mg
0.29mg
27%
Sodium
598mg
1mg
26%
Vitamin B1
0.39mg
0.079mg
26%
Manganese
0.36mg
0.927mg
25%
Protein
11.39g
0.54g
22%
Vitamin B3
3.825mg
0.5mg
21%
Saturated fat
4.465g
0.009g
20%
Folate
93µg
18µg
19%
Calcium
188mg
13mg
18%
Vitamin B12
0.42µg
0µg
18%
Fats
9.69g
0.12g
15%
Vitamin B2
0.195mg
0.032mg
13%
Calories
266kcal
50kcal
11%
Zinc
1.34mg
0.12mg
11%
Starch
26.95g
0g
11%
Polyunsaturated fat
1.681g
0.04g
11%
Carbs
33.33g
13.12g
7%
Vitamin A
69µg
3µg
7%
Cholesterol
17mg
0mg
6%
Monounsaturated fat
2.608g
0.013g
6%
Vitamin E
0.83mg
0.02mg
5%
Vitamin K
6.7µg
0.7µg
5%
Fiber
2.3g
1.4g
4%
Vitamin B5
0.213mg
4%
Magnesium
24mg
12mg
3%
Potassium
172mg
109mg
2%
Vitamin B6
0.08mg
0.112mg
2%
Choline
16.4mg
5.5mg
2%
Copper
0.105mg
0.11mg
1%
Fructose
1g
2.12g
1%
Protein per 100 calories
4.3g
1.1g
N/A
Calories per 10 g protein
234kcal
926kcal
N/A
Weight per 100 calories
38g
200g
N/A
Unsaturated / Saturated Fat ratio
0.96
5.9
N/A
Net carbs
31.03g
11.72g
N/A
Sugar
3.58g
9.85g
N/A
Trans fat
0.241g
0g
N/A
Tryptophan
0.005mg
0%
Threonine
0.41mg
0.019mg
0%
Isoleucine
0.564mg
0.019mg
0%
Leucine
1.139mg
0.024mg
0%
Lysine
0.77mg
0.026mg
0%
Methionine
0.264mg
0.012mg
0%
Phenylalanine
0.664mg
0.021mg
0%
Valine
0.72mg
0.024mg
0%
Histidine
0.355mg
0.01mg
0%
Omega-3 - EPA
0.004g
0g
N/A
Omega-3 - ALA
0.175g
N/A
Omega-3 - DPA
0.004g
0g
N/A
Omega-6 - Gamma-linoleic acid
0.003g
N/A
Omega-6 - Dihomo-gamma-linoleic acid
0.009g
N/A
Omega-6 - Eicosadienoic acid
0.003g
N/A
Omega-6 - Linoleic acid
1.367g
N/A
Macronutrient Comparison
Macronutrient breakdown side-by-side comparison
4
11%
10%
33%
43%
2%
Protein:
11.39 g
Fats:
9.69 g
Carbs:
33.33 g
Water:
43.17 g
Other:
2.42 g
1
13%
86%
Protein:
0.54 g
Fats:
0.12 g
Carbs:
13.12 g
Water:
86 g
Other:
0.22 g
Contains
more
Protein Protein
+2009.3%
Contains
more
Fats Fats
+7975%
Contains
more
Carbs Carbs
+154%
Contains
more
Other Other
+1000%
Contains
more
Water Water
+99.2%
Fat Type Comparison
Fat type breakdown side-by-side comparison
2
51%
30%
19%
Saturated fat:
Sat. Fat
4.465 g
Monounsaturated fat:
Mono. Fat
2.608 g
Polyunsaturated fat:
Poly. Fat
1.681 g
1
15%
21%
65%
Saturated fat:
Sat. Fat
0.009 g
Monounsaturated fat:
Mono. Fat
0.013 g
Polyunsaturated fat:
Poly. Fat
0.04 g
Contains
more
Mono. Fat Monounsaturated fat
+19961.5%
Contains
more
Poly. Fat Polyunsaturated fat
+4102.5%
Contains
less
Sat. Fat Saturated fat
-99.8%
Carbohydrate type comparison
Carbohydrate type breakdown side-by-side comparison
4
88%
3%
3%
3%
Starch:
26.95 g
Sucrose:
0.2 g
Glucose:
0.78 g
Fructose:
1 g
Lactose:
0.42 g
Maltose:
1.05 g
Galactose:
0.13 g
3
61%
18%
22%
Starch:
0 g
Sucrose:
5.99 g
Glucose:
1.73 g
Fructose:
2.12 g
Lactose:
0 g
Maltose:
0 g
Galactose:
0 g
Contains
more
Starch Starch
+∞%
Contains
more
Lactose Lactose
+∞%
Contains
more
Maltose Maltose
+∞%
Contains
more
Galactose Galactose
+∞%
Contains
more
Sucrose Sucrose
+2895%
Contains
more
Glucose Glucose
+121.8%
Contains
more
Fructose Fructose
+112%