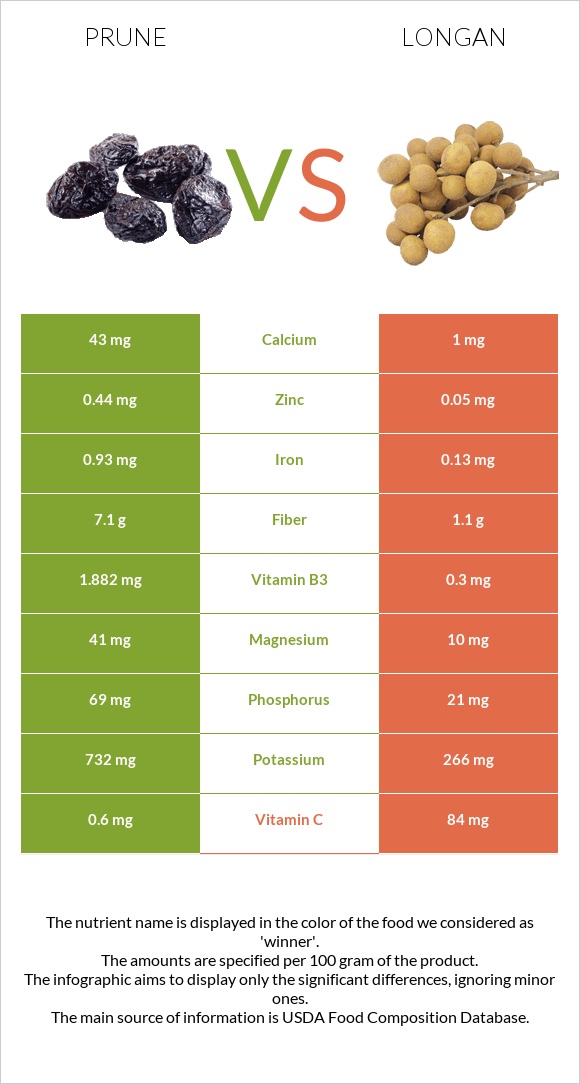
Summary of differences between prunes and longan Prunes have more fiber, potassium, copper, manganese, iron, vitamin B3, magnesium, and phosphorus, while longan has more vitamin C. Longan covers your daily need for vitamin C, 93% more than prunes. Prunes contain 43 times more calcium than longan. While prunes contain 43mg of calcium, longan contains only 1mg. Prunes have a lower glycemic index. The glycemic index of prunes is 29, while the glycemic index of longan is 45. These are the specific foods used in this comparison Plums, dried (prunes), uncooked and Longans, raw .
Infographic
Mineral Comparison
Mineral comparison score is based on the number of minerals by which one or the other food is richer. The "coverage" charts below show how much of the daily needs can be covered by 300 grams of the food.
9
100 g
300 g
1 prune, pitted - 9.5g 1 cup, pitted - 174g
Magnesium
Magnesium
Calcium
Calcium
Potassium
Potassium
Iron
Iron
Copper
Copper
Zinc
Zinc
Phosphorus
Phosphorus
Sodium
Sodium
Manganese
Manganese
Selenium
Selenium
29%
13%
65%
35%
94%
12%
30%
0.26%
39%
1.6%
1
100 g
300 g
1 fruit without refuse - 3.2g
Magnesium
Magnesium
Calcium
Calcium
Potassium
Potassium
Iron
Iron
Copper
Copper
Zinc
Zinc
Phosphorus
Phosphorus
Sodium
Sodium
Manganese
Manganese
Selenium
Selenium
7.1%
0.3%
23%
4.9%
56%
1.4%
9%
0%
6.8%
0%
Vitamin Comparison
Vitamin comparison score is based on the number of vitamins by which one or the other food is richer. The "coverage" charts below show how much of the daily needs can be covered by 300 grams of the food.
9
100 g
300 g
1 prune, pitted - 9.5g 1 cup, pitted - 174g
Vitamin C
Vit. C
Vitamin D
Vit. D
Vitamin A
Vit. A
Vitamin E
Vit. E
Vitamin B1
Vit. B1
Vitamin B2
Vit. B2
Vitamin B3
Vit. B3
Vitamin B5
Vit. B5
Vitamin B6
Vit. B6
Vitamin B12
Vit. B12
Vitamin K
Vit. K
Folate
Folate
2%
0%
13%
8.6%
13%
43%
35%
25%
47%
0%
149%
3%
1
100 g
300 g
1 fruit without refuse - 3.2g
Vitamin C
Vit. C
Vitamin D
Vit. D
Vitamin A
Vit. A
Vitamin E
Vit. E
Vitamin B1
Vit. B1
Vitamin B2
Vit. B2
Vitamin B3
Vit. B3
Vitamin B5
Vit. B5
Vitamin B6
Vit. B6
Vitamin B12
Vit. B12
Vitamin K
Vit. K
Folate
Folate
280%
0%
0%
0%
7.8%
32%
5.6%
0%
0%
0%
0%
0%
All nutrients comparison - raw data values
Nutrient
DV% diff.
Vitamin C
0.6mg
84mg
93%
Vitamin K
59.5µg
50%
Fiber
7.1g
1.1g
24%
Carbs
63.88g
15.14g
16%
Vitamin B6
0.205mg
16%
Fructose
12.45g
16%
Potassium
732mg
266mg
14%
Copper
0.281mg
0.169mg
12%
Manganese
0.299mg
0.052mg
11%
Iron
0.93mg
0.13mg
10%
Vitamin B3
1.882mg
0.3mg
10%
Calories
240kcal
60kcal
9%
Vitamin B5
0.422mg
8%
Magnesium
41mg
10mg
7%
Phosphorus
69mg
21mg
7%
Calcium
43mg
1mg
4%
Zinc
0.44mg
0.05mg
4%
Vitamin A
39µg
4%
Vitamin B2
0.186mg
0.14mg
4%
Vitamin E
0.43mg
3%
Protein
2.18g
1.31g
2%
Starch
5.11g
2%
Vitamin B1
0.051mg
0.031mg
2%
Choline
10.1mg
2%
Selenium
0.3µg
1%
Folate
4µg
1%
Protein per 100 calories
0.91g
2.2g
N/A
Calories per 10 g protein
1101kcal
458kcal
N/A
Weight per 100 calories
42g
167g
N/A
Fats
0.38g
0.1g
0%
Net carbs
56.78g
14.04g
N/A
Sugar
38.13g
N/A
Sodium
2mg
0mg
0%
Saturated fat
0.088g
0%
Monounsaturated fat
0.053g
0%
Polyunsaturated fat
0.062g
0%
Tryptophan
0.025mg
0%
Threonine
0.049mg
0.034mg
0%
Isoleucine
0.041mg
0.026mg
0%
Leucine
0.066mg
0.054mg
0%
Lysine
0.05mg
0.046mg
0%
Methionine
0.016mg
0.013mg
0%
Phenylalanine
0.052mg
0.03mg
0%
Valine
0.056mg
0.058mg
0%
Histidine
0.027mg
0.012mg
0%
Macronutrient Comparison
Macronutrient breakdown side-by-side comparison
4
2%
64%
31%
3%
Protein:
2.18 g
Fats:
0.38 g
Carbs:
63.88 g
Water:
30.92 g
Other:
2.64 g
1
15%
83%
Protein:
1.31 g
Fats:
0.1 g
Carbs:
15.14 g
Water:
82.75 g
Other:
0.7 g
Contains
more
Protein Protein
+66.4%
Contains
more
Fats Fats
+280%
Contains
more
Carbs Carbs
+321.9%
Contains
more
Other Other
+277.1%
Contains
more
Water Water
+167.6%