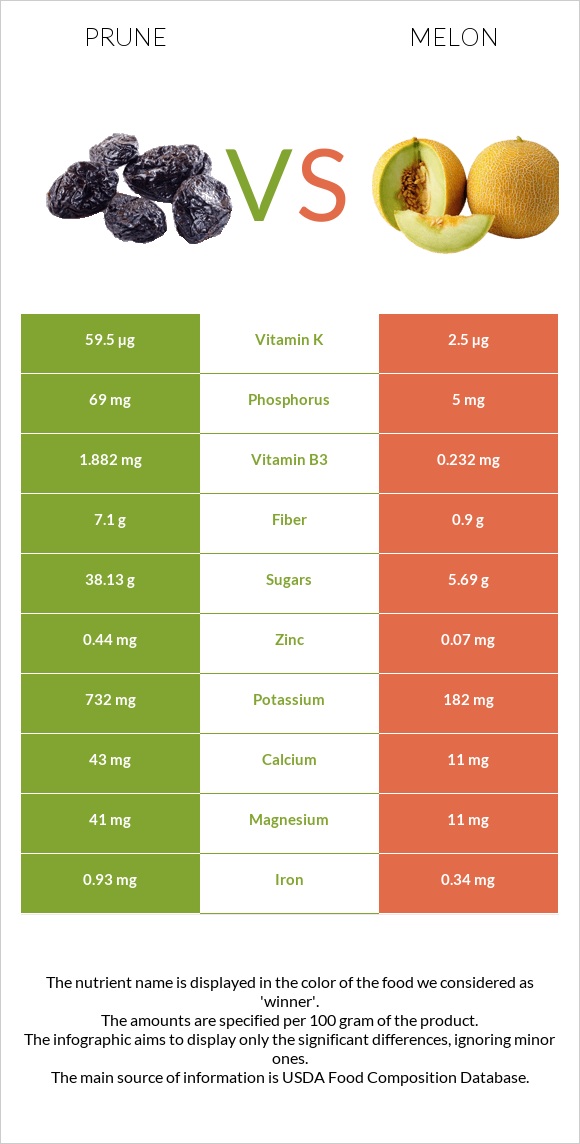
The main differences between prunes and melon Prunes have more vitamin K, fiber, copper, potassium, vitamin A, vitamin B2, manganese, vitamin B3, and phosphorus; however, melon has more vitamin C. Daily need coverage for vitamin K for prunes is 47% higher. Melon has a higher glycemic index than prunes. Food types used in this article are Plums, dried (prunes), uncooked and Melons, casaba, raw .
Infographic
Mineral Comparison
Mineral comparison score is based on the number of minerals by which one or the other food is richer. The "coverage" charts below show how much of the daily needs can be covered by 300 grams of the food.
9
100 g
300 g
1 prune, pitted - 9.5g 1 cup, pitted - 174g
Magnesium
Magnesium
Calcium
Calcium
Potassium
Potassium
Iron
Iron
Copper
Copper
Zinc
Zinc
Phosphorus
Phosphorus
Sodium
Sodium
Manganese
Manganese
Selenium
Selenium
29%
13%
65%
35%
94%
12%
30%
0.26%
39%
1.6%
1
100 g
300 g
0.1 fruit - 164g 1 cup, cubes - 170g 1 melon - 1640g
Magnesium
Magnesium
Calcium
Calcium
Potassium
Potassium
Iron
Iron
Copper
Copper
Zinc
Zinc
Phosphorus
Phosphorus
Sodium
Sodium
Manganese
Manganese
Selenium
Selenium
7.9%
3.3%
16%
13%
20%
1.9%
2.1%
1.2%
4.6%
2.2%
Vitamin Comparison
Vitamin comparison score is based on the number of vitamins by which one or the other food is richer. The "coverage" charts below show how much of the daily needs can be covered by 300 grams of the food.
8
100 g
300 g
1 prune, pitted - 9.5g 1 cup, pitted - 174g
Vitamin C
Vit. C
Vitamin D
Vit. D
Vitamin A
Vit. A
Vitamin E
Vit. E
Vitamin B1
Vit. B1
Vitamin B2
Vit. B2
Vitamin B3
Vit. B3
Vitamin B5
Vit. B5
Vitamin B6
Vit. B6
Vitamin B12
Vit. B12
Vitamin K
Vit. K
Folate
Folate
2%
0%
13%
8.6%
13%
43%
35%
25%
47%
0%
149%
3%
2
100 g
300 g
0.1 fruit - 164g 1 cup, cubes - 170g 1 melon - 1640g
Vitamin C
Vit. C
Vitamin D
Vit. D
Vitamin A
Vit. A
Vitamin E
Vit. E
Vitamin B1
Vit. B1
Vitamin B2
Vit. B2
Vitamin B3
Vit. B3
Vitamin B5
Vit. B5
Vitamin B6
Vit. B6
Vitamin B12
Vit. B12
Vitamin K
Vit. K
Folate
Folate
73%
0%
0%
1%
3.8%
7.2%
4.4%
5%
38%
0%
6.3%
6%
All nutrients comparison - raw data values
Nutrient
DV% diff.
Vitamin K
59.5µg
2.5µg
48%
Fiber
7.1g
0.9g
25%
Copper
0.281mg
0.06mg
25%
Vitamin C
0.6mg
21.8mg
24%
Carbs
63.88g
6.58g
19%
Potassium
732mg
182mg
16%
Fructose
12.45g
16%
Vitamin B2
0.186mg
0.031mg
12%
Calories
240kcal
28kcal
11%
Manganese
0.299mg
0.035mg
11%
Vitamin B3
1.882mg
0.232mg
10%
Phosphorus
69mg
5mg
9%
Magnesium
41mg
11mg
7%
Iron
0.93mg
0.34mg
7%
Vitamin B5
0.422mg
0.084mg
7%
Vitamin A
39µg
0µg
4%
Calcium
43mg
11mg
3%
Zinc
0.44mg
0.07mg
3%
Vitamin E
0.43mg
0.05mg
3%
Vitamin B1
0.051mg
0.015mg
3%
Vitamin B6
0.205mg
0.163mg
3%
Protein
2.18g
1.11g
2%
Starch
5.11g
2%
Folate
4µg
8µg
1%
Protein per 100 calories
0.91g
4g
N/A
Calories per 10 g protein
1101kcal
252kcal
N/A
Weight per 100 calories
42g
357g
N/A
Fats
0.38g
0.1g
0%
Net carbs
56.78g
5.68g
N/A
Sugar
38.13g
5.69g
N/A
Sodium
2mg
9mg
0%
Selenium
0.3µg
0.4µg
0%
Choline
10.1mg
7.6mg
0%
Saturated fat
0.088g
0.025g
0%
Monounsaturated fat
0.053g
0.002g
0%
Polyunsaturated fat
0.062g
0.039g
0%
Tryptophan
0.025mg
0%
Threonine
0.049mg
0%
Isoleucine
0.041mg
0%
Leucine
0.066mg
0%
Lysine
0.05mg
0%
Methionine
0.016mg
0%
Phenylalanine
0.052mg
0%
Valine
0.056mg
0%
Histidine
0.027mg
0%
Macronutrient Comparison
Macronutrient breakdown side-by-side comparison
4
2%
64%
31%
3%
Protein:
2.18 g
Fats:
0.38 g
Carbs:
63.88 g
Water:
30.92 g
Other:
2.64 g
1
7%
92%
Protein:
1.11 g
Fats:
0.1 g
Carbs:
6.58 g
Water:
91.85 g
Other:
0.36 g
Contains
more
Protein Protein
+96.4%
Contains
more
Fats Fats
+280%
Contains
more
Carbs Carbs
+870.8%
Contains
more
Other Other
+633.3%
Contains
more
Water Water
+197.1%
Fat Type Comparison
Fat type breakdown side-by-side comparison
2
43%
26%
31%
Saturated fat:
Sat. Fat
0.088 g
Monounsaturated fat:
Mono. Fat
0.053 g
Polyunsaturated fat:
Poly. Fat
0.062 g
1
38%
3%
59%
Saturated fat:
Sat. Fat
0.025 g
Monounsaturated fat:
Mono. Fat
0.002 g
Polyunsaturated fat:
Poly. Fat
0.039 g
Contains
more
Mono. Fat Monounsaturated fat
+2550%
Contains
more
Poly. Fat Polyunsaturated fat
+59%
Contains
less
Sat. Fat Saturated fat
-71.6%