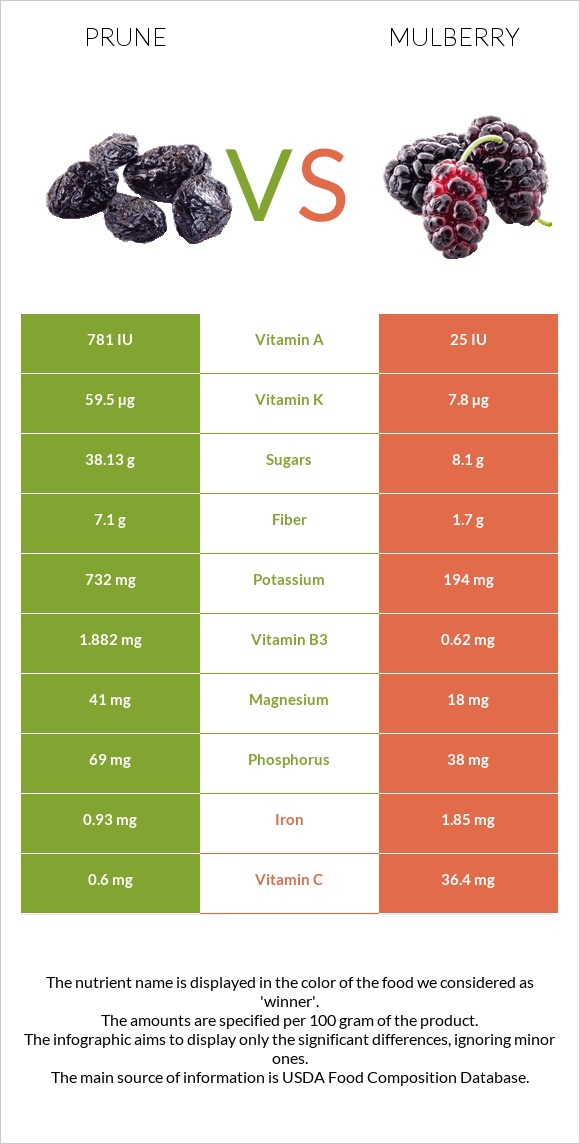
Differences between prunes and mulberries Prunes are higher in vitamin K, copper, fiber, potassium, vitamin A, vitamin B6, vitamin B3, and vitamin B2; however, mulberries are richer in vitamin C and iron. Prunes' daily need coverage for vitamin K is 43% higher. Prunes have 31 times more vitamin A than mulberries. While prunes have 781 IU of vitamin A, mulberries have only 25 IU. The food types used in this comparison are Plums, dried (prunes), uncooked and Mulberries, raw .
Infographic
Mineral Comparison
Mineral comparison score is based on the number of minerals by which one or the other food is richer. The "coverage" charts below show how much of the daily needs can be covered by 300 grams of the food.
7
100 g
300 g
1 prune, pitted - 9.5g 1 cup, pitted - 174g
Magnesium
Magnesium
Calcium
Calcium
Potassium
Potassium
Iron
Iron
Copper
Copper
Zinc
Zinc
Phosphorus
Phosphorus
Sodium
Sodium
Manganese
Manganese
Selenium
Selenium
29%
13%
65%
35%
94%
12%
30%
0.26%
39%
1.6%
2
100 g
300 g
10 fruit - 15g 1 cup - 140g
Magnesium
Magnesium
Calcium
Calcium
Potassium
Potassium
Iron
Iron
Copper
Copper
Zinc
Zinc
Phosphorus
Phosphorus
Sodium
Sodium
Manganese
Manganese
Selenium
Selenium
13%
12%
17%
69%
20%
3.3%
16%
1.3%
0%
3.3%
Vitamin Comparison
Vitamin comparison score is based on the number of vitamins by which one or the other food is richer. The "coverage" charts below show how much of the daily needs can be covered by 300 grams of the food.
7
100 g
300 g
1 prune, pitted - 9.5g 1 cup, pitted - 174g
Vitamin C
Vit. C
Vitamin D
Vit. D
Vitamin A
Vit. A
Vitamin E
Vit. E
Vitamin B1
Vit. B1
Vitamin B2
Vit. B2
Vitamin B3
Vit. B3
Vitamin B5
Vit. B5
Vitamin B6
Vit. B6
Vitamin B12
Vit. B12
Vitamin K
Vit. K
Folate
Folate
2%
0%
13%
8.6%
13%
43%
35%
25%
47%
0%
149%
3%
3
100 g
300 g
10 fruit - 15g 1 cup - 140g
Vitamin C
Vit. C
Vitamin D
Vit. D
Vitamin A
Vit. A
Vitamin E
Vit. E
Vitamin B1
Vit. B1
Vitamin B2
Vit. B2
Vitamin B3
Vit. B3
Vitamin B5
Vit. B5
Vitamin B6
Vit. B6
Vitamin B12
Vit. B12
Vitamin K
Vit. K
Folate
Folate
121%
0%
0.33%
17%
7.3%
23%
12%
0%
12%
0%
20%
4.5%
All nutrients comparison - raw data values
Nutrient
DV% diff.
Vitamin K
59.5µg
7.8µg
43%
Vitamin C
0.6mg
36.4mg
40%
Copper
0.281mg
0.06mg
25%
Fiber
7.1g
1.7g
22%
Carbs
63.88g
9.8g
18%
Potassium
732mg
194mg
16%
Fructose
12.45g
16%
Manganese
0.299mg
13%
Iron
0.93mg
1.85mg
12%
Vitamin B6
0.205mg
0.05mg
12%
Calories
240kcal
43kcal
10%
Vitamin B3
1.882mg
0.62mg
8%
Vitamin B5
0.422mg
8%
Vitamin B2
0.186mg
0.101mg
7%
Magnesium
41mg
18mg
5%
Phosphorus
69mg
38mg
4%
Vitamin A
39µg
1µg
4%
Zinc
0.44mg
0.12mg
3%
Vitamin E
0.43mg
0.87mg
3%
Starch
5.11g
2%
Vitamin B1
0.051mg
0.029mg
2%
Protein
2.18g
1.44g
1%
Selenium
0.3µg
0.6µg
1%
Folate
4µg
6µg
1%
Polyunsaturated fat
0.062g
0.207g
1%
Protein per 100 calories
0.91g
3.3g
N/A
Calories per 10 g protein
1101kcal
299kcal
N/A
Weight per 100 calories
42g
233g
N/A
Fats
0.38g
0.39g
0%
Net carbs
56.78g
8.1g
N/A
Calcium
43mg
39mg
0%
Sugar
38.13g
8.1g
N/A
Sodium
2mg
10mg
0%
Choline
10.1mg
12.3mg
0%
Saturated fat
0.088g
0.027g
0%
Monounsaturated fat
0.053g
0.041g
0%
Tryptophan
0.025mg
0%
Threonine
0.049mg
0%
Isoleucine
0.041mg
0%
Leucine
0.066mg
0%
Lysine
0.05mg
0%
Methionine
0.016mg
0%
Phenylalanine
0.052mg
0%
Valine
0.056mg
0%
Histidine
0.027mg
0%
Macronutrient Comparison
Macronutrient breakdown side-by-side comparison
3
2%
64%
31%
3%
Protein:
2.18 g
Fats:
0.38 g
Carbs:
63.88 g
Water:
30.92 g
Other:
2.64 g
2
10%
88%
Protein:
1.44 g
Fats:
0.39 g
Carbs:
9.8 g
Water:
87.68 g
Other:
0.69 g
Contains
more
Protein Protein
+51.4%
Contains
more
Carbs Carbs
+551.8%
Contains
more
Other Other
+282.6%
Contains
more
Water Water
+183.6%
Fat Type Comparison
Fat type breakdown side-by-side comparison
1
43%
26%
31%
Saturated fat:
Sat. Fat
0.088 g
Monounsaturated fat:
Mono. Fat
0.053 g
Polyunsaturated fat:
Poly. Fat
0.062 g
2
10%
15%
75%
Saturated fat:
Sat. Fat
0.027 g
Monounsaturated fat:
Mono. Fat
0.041 g
Polyunsaturated fat:
Poly. Fat
0.207 g
Contains
more
Mono. Fat Monounsaturated fat
+29.3%
Contains
less
Sat. Fat Saturated fat
-69.3%
Contains
more
Poly. Fat Polyunsaturated fat
+233.9%