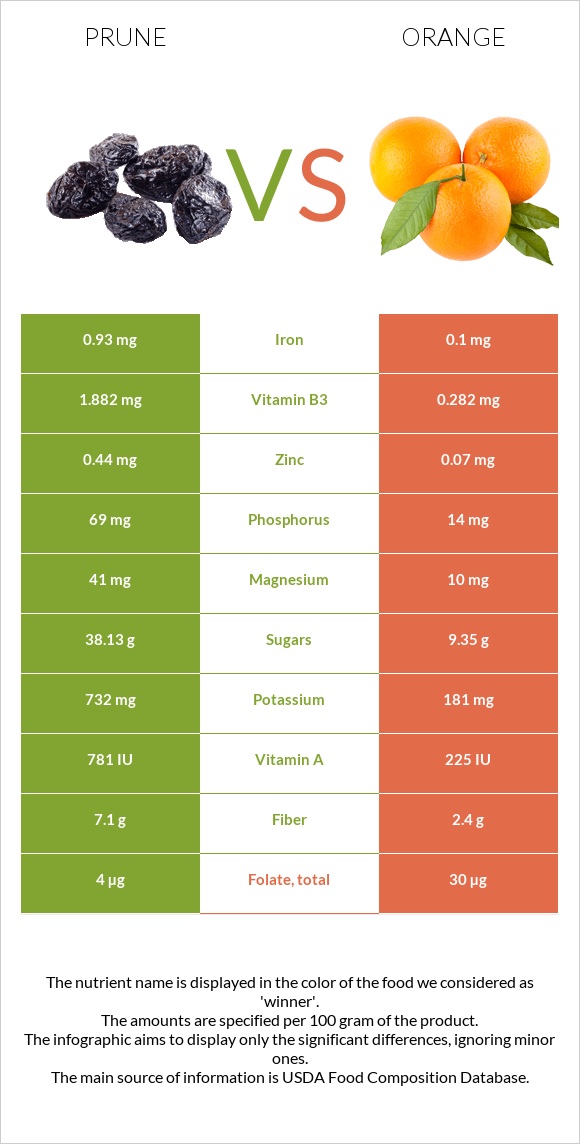
Differences between prunes and oranges Prunes are higher in vitamin K, copper, fiber, potassium, manganese, vitamin B2, vitamin B6, vitamin A, and iron; however, oranges are richer in vitamin C. Oranges' daily need coverage for vitamin C is 58% higher. Prunes have a lower glycemic index (29) than oranges (45). The food types used in this comparison are Plums, dried (prunes), uncooked and Oranges, raw, all commercial varieties .
Infographic
Mineral Comparison
Mineral comparison score is based on the number of minerals by which one or the other food is richer. The "coverage" charts below show how much of the daily needs can be covered by 300 grams of the food.
7
100 g
300 g
1 prune, pitted - 9.5g 1 cup, pitted - 174g
Magnesium
Magnesium
Calcium
Calcium
Potassium
Potassium
Iron
Iron
Copper
Copper
Zinc
Zinc
Phosphorus
Phosphorus
Sodium
Sodium
Manganese
Manganese
Selenium
Selenium
29%
13%
65%
35%
94%
12%
30%
0.26%
39%
1.6%
2
100 g
300 g
1 small (2-3/8" dia) - 96g 1 fruit (2-5/8" dia) - 131g 1 cup, sections - 180g 1 large (3-1/16" dia) - 184g
Magnesium
Magnesium
Calcium
Calcium
Potassium
Potassium
Iron
Iron
Copper
Copper
Zinc
Zinc
Phosphorus
Phosphorus
Sodium
Sodium
Manganese
Manganese
Selenium
Selenium
7.1%
12%
16%
3.8%
15%
1.9%
6%
0%
3.3%
2.7%
Vitamin Comparison
Vitamin comparison score is based on the number of vitamins by which one or the other food is richer. The "coverage" charts below show how much of the daily needs can be covered by 300 grams of the food.
7
100 g
300 g
1 prune, pitted - 9.5g 1 cup, pitted - 174g
Vitamin C
Vit. C
Vitamin D
Vit. D
Vitamin A
Vit. A
Vitamin E
Vit. E
Vitamin B1
Vit. B1
Vitamin B2
Vit. B2
Vitamin B3
Vit. B3
Vitamin B5
Vit. B5
Vitamin B6
Vit. B6
Vitamin B12
Vit. B12
Vitamin K
Vit. K
Folate
Folate
2%
0%
13%
8.6%
13%
43%
35%
25%
47%
0%
149%
3%
3
100 g
300 g
1 small (2-3/8" dia) - 96g 1 fruit (2-5/8" dia) - 131g 1 cup, sections - 180g 1 large (3-1/16" dia) - 184g
Vitamin C
Vit. C
Vitamin D
Vit. D
Vitamin A
Vit. A
Vitamin E
Vit. E
Vitamin B1
Vit. B1
Vitamin B2
Vit. B2
Vitamin B3
Vit. B3
Vitamin B5
Vit. B5
Vitamin B6
Vit. B6
Vitamin B12
Vit. B12
Vitamin K
Vit. K
Folate
Folate
177%
0%
3.7%
3.6%
22%
9.2%
5.3%
15%
14%
0%
0%
23%
All nutrients comparison - raw data values
Nutrient
DV% diff.
Vitamin C
0.6mg
53.2mg
58%
Vitamin K
59.5µg
0µg
50%
Copper
0.281mg
0.045mg
26%
Fiber
7.1g
2.4g
19%
Carbs
63.88g
11.75g
17%
Potassium
732mg
181mg
16%
Fructose
12.45g
16%
Manganese
0.299mg
0.025mg
12%
Vitamin B2
0.186mg
0.04mg
11%
Vitamin B6
0.205mg
0.06mg
11%
Calories
240kcal
47kcal
10%
Iron
0.93mg
0.1mg
10%
Vitamin B3
1.882mg
0.282mg
10%
Phosphorus
69mg
14mg
8%
Magnesium
41mg
10mg
7%
Folate
4µg
30µg
7%
Zinc
0.44mg
0.07mg
3%
Vitamin A
39µg
11µg
3%
Vitamin B1
0.051mg
0.087mg
3%
Vitamin B5
0.422mg
0.25mg
3%
Protein
2.18g
0.94g
2%
Starch
5.11g
2%
Vitamin E
0.43mg
0.18mg
2%
Protein per 100 calories
0.91g
2g
N/A
Calories per 10 g protein
1101kcal
500kcal
N/A
Weight per 100 calories
42g
213g
N/A
Fats
0.38g
0.12g
0%
Net carbs
56.78g
9.35g
N/A
Calcium
43mg
40mg
0%
Sugar
38.13g
9.35g
N/A
Sodium
2mg
0mg
0%
Selenium
0.3µg
0.5µg
0%
Choline
10.1mg
8.4mg
0%
Saturated fat
0.088g
0.015g
0%
Monounsaturated fat
0.053g
0.023g
0%
Polyunsaturated fat
0.062g
0.025g
0%
Tryptophan
0.025mg
0.009mg
0%
Threonine
0.049mg
0.015mg
0%
Isoleucine
0.041mg
0.025mg
0%
Leucine
0.066mg
0.023mg
0%
Lysine
0.05mg
0.047mg
0%
Methionine
0.016mg
0.02mg
0%
Phenylalanine
0.052mg
0.031mg
0%
Valine
0.056mg
0.04mg
0%
Histidine
0.027mg
0.018mg
0%
Macronutrient Comparison
Macronutrient breakdown side-by-side comparison
4
2%
64%
31%
3%
Protein:
2.18 g
Fats:
0.38 g
Carbs:
63.88 g
Water:
30.92 g
Other:
2.64 g
1
12%
87%
Protein:
0.94 g
Fats:
0.12 g
Carbs:
11.75 g
Water:
86.75 g
Other:
0.44 g
Contains
more
Protein Protein
+131.9%
Contains
more
Fats Fats
+216.7%
Contains
more
Carbs Carbs
+443.7%
Contains
more
Other Other
+500%
Contains
more
Water Water
+180.6%
Fat Type Comparison
Fat type breakdown side-by-side comparison
2
43%
26%
31%
Saturated fat:
Sat. Fat
0.088 g
Monounsaturated fat:
Mono. Fat
0.053 g
Polyunsaturated fat:
Poly. Fat
0.062 g
1
24%
37%
40%
Saturated fat:
Sat. Fat
0.015 g
Monounsaturated fat:
Mono. Fat
0.023 g
Polyunsaturated fat:
Poly. Fat
0.025 g
Contains
more
Mono. Fat Monounsaturated fat
+130.4%
Contains
more
Poly. Fat Polyunsaturated fat
+148%
Contains
less
Sat. Fat Saturated fat
-83%