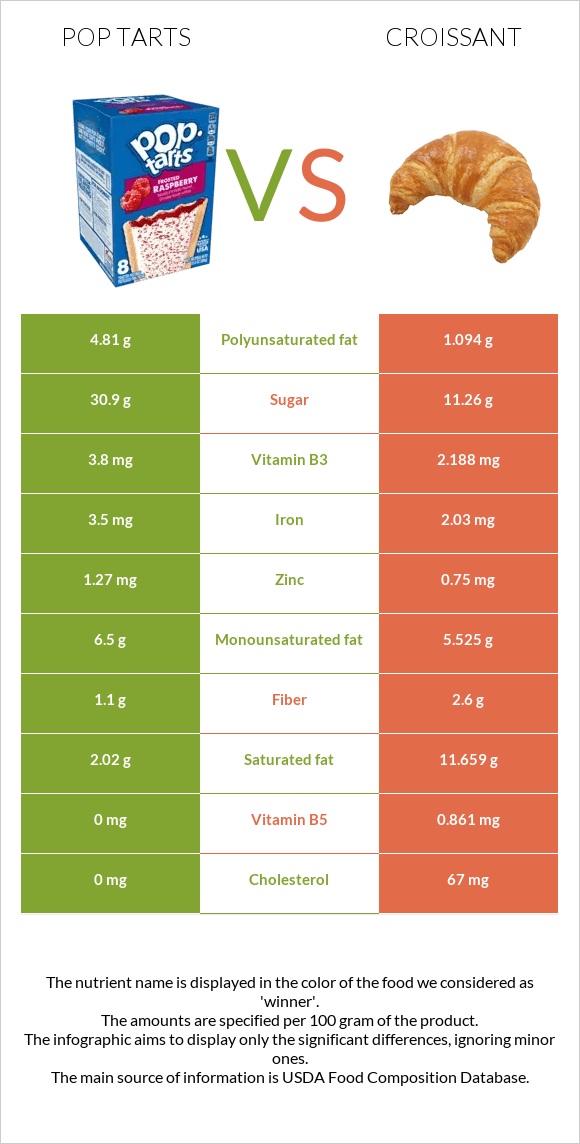
A recap on the differences between pop tarts and croissant Pop tarts are higher in vitamin B6, iron, vitamin B3, copper, and vitamin B2, yet croissant is higher in vitamin B5, vitamin B1, and vitamin B12. Croissant covers your daily saturated fat needs 48% more than pop tarts. Pop tarts contain 7 times more vitamin B6 than croissant. While pop tarts contain 0.38mg of vitamin B6, croissant contains only 0.058mg. The amount of saturated fat in pop tarts is lower. The glycemic index of croissant is lower. Food varieties used in this article are Toaster Pastries, KELLOGG, KELLOGG'S POP TARTS, Blueberry and Croissants, butter .
Infographic
Mineral Comparison
Mineral comparison score is based on the number of minerals by which one or the other food is richer. The "coverage" charts below show how much of the daily needs can be covered by 300 grams of the food.
4
100 g
300 g
1 pastry - 52g
Magnesium
Magnesium
Calcium
Calcium
Potassium
Potassium
Iron
Iron
Copper
Copper
Zinc
Zinc
Phosphorus
Phosphorus
Sodium
Sodium
Manganese
Manganese
Selenium
Selenium
11%
7.2%
8.4%
131%
50%
35%
38%
52%
0%
0%
5
100 g
300 g
1 croissant, mini - 28g 1 oz - 28.35g 1 croissant, small - 42g 1 croissant, medium - 57g 1 croissant, large - 67g
Magnesium
Magnesium
Calcium
Calcium
Potassium
Potassium
Iron
Iron
Copper
Copper
Zinc
Zinc
Phosphorus
Phosphorus
Sodium
Sodium
Manganese
Manganese
Selenium
Selenium
11%
11%
10%
76%
27%
20%
45%
61%
43%
124%
Vitamin Comparison
Vitamin comparison score is based on the number of vitamins by which one or the other food is richer. The "coverage" charts below show how much of the daily needs can be covered by 300 grams of the food.
4
100 g
300 g
1 pastry - 52g
Vitamin C
Vit. C
Vitamin D
Vit. D
Vitamin A
Vit. A
Vitamin E
Vit. E
Vitamin B1
Vit. B1
Vitamin B2
Vit. B2
Vitamin B3
Vit. B3
Vitamin B5
Vit. B5
Vitamin B6
Vit. B6
Vitamin B12
Vit. B12
Vitamin K
Vit. K
Folate
Folate
0%
0%
96%
0%
73%
76%
71%
0%
88%
0%
0%
60%
6
100 g
300 g
1 croissant, mini - 28g 1 oz - 28.35g 1 croissant, small - 42g 1 croissant, medium - 57g 1 croissant, large - 67g
Vitamin C
Vit. C
Vitamin D
Vit. D
Vitamin A
Vit. A
Vitamin E
Vit. E
Vitamin B1
Vit. B1
Vitamin B2
Vit. B2
Vitamin B3
Vit. B3
Vitamin B5
Vit. B5
Vitamin B6
Vit. B6
Vitamin B12
Vit. B12
Vitamin K
Vit. K
Folate
Folate
0.67%
0%
69%
17%
97%
56%
41%
52%
13%
20%
4.5%
66%
All nutrients comparison - raw data values
Nutrient
DV% diff.
Saturated fat
2.02g
11.659g
44%
Selenium
22.7µg
41%
Vitamin B6
0.38mg
0.058mg
25%
Polyunsaturated fat
4.81g
1.094g
25%
Cholesterol
0mg
67mg
22%
Iron
3.5mg
2.03mg
18%
Vitamin B5
0mg
0.861mg
17%
Manganese
0.33mg
14%
Fats
13.3g
21g
12%
Vitamin B3
3.8mg
2.188mg
10%
Vitamin A
289µg
206µg
9%
Carbs
68.41g
45.8g
8%
Copper
0.15mg
0.08mg
8%
Vitamin B1
0.29mg
0.388mg
8%
Protein
4.6g
8.2g
7%
Vitamin B2
0.33mg
0.241mg
7%
Vitamin B12
0µg
0.16µg
7%
Choline
38.8mg
7%
Fiber
1.1g
2.6g
6%
Vitamin E
0.84mg
6%
Zinc
1.27mg
0.75mg
5%
Sodium
398mg
467mg
3%
Phosphorus
88mg
105mg
2%
Vitamin K
1.8µg
2%
Folate
80µg
88µg
2%
Monounsaturated fat
6.5g
5.525g
2%
Calcium
24mg
37mg
1%
Potassium
95mg
118mg
1%
Calories
412kcal
406kcal
0%
Protein per 100 calories
1.1g
2g
N/A
Calories per 10 g protein
896kcal
495kcal
N/A
Weight per 100 calories
24g
25g
N/A
Unsaturated / Saturated Fat ratio
5.6
0.57
N/A
Vitamin C
0mg
0.2mg
0%
Net carbs
67.31g
43.2g
N/A
Magnesium
16mg
16mg
0%
Sugar
30.9g
11.26g
N/A
Tryptophan
0.099mg
0%
Threonine
0.284mg
0%
Isoleucine
0.365mg
0%
Leucine
0.623mg
0%
Lysine
0.329mg
0%
Methionine
0.175mg
0%
Phenylalanine
0.416mg
0%
Valine
0.41mg
0%
Histidine
0.187mg
0%
Omega-3 - EPA
0.003g
N/A
Omega-3 - DHA
0.002g
N/A
Macronutrient Comparison
Macronutrient breakdown side-by-side comparison
1
5%
13%
68%
13%
Protein:
4.6 g
Fats:
13.3 g
Carbs:
68.41 g
Water:
12.5 g
Other:
1.19 g
4
8%
21%
46%
23%
2%
Protein:
8.2 g
Fats:
21 g
Carbs:
45.8 g
Water:
23.2 g
Other:
1.8 g
Contains
more
Carbs Carbs
+49.4%
Contains
more
Protein Protein
+78.3%
Contains
more
Fats Fats
+57.9%
Contains
more
Water Water
+85.6%
Contains
more
Other Other
+51.3%
Fat Type Comparison
Fat type breakdown side-by-side comparison
3
15%
49%
36%
Saturated fat:
Sat. Fat
2.02 g
Monounsaturated fat:
Mono. Fat
6.5 g
Polyunsaturated fat:
Poly. Fat
4.81 g
0
64%
30%
6%
Saturated fat:
Sat. Fat
11.659 g
Monounsaturated fat:
Mono. Fat
5.525 g
Polyunsaturated fat:
Poly. Fat
1.094 g
Contains
less
Sat. Fat Saturated fat
-82.7%
Contains
more
Mono. Fat Monounsaturated fat
+17.6%
Contains
more
Poly. Fat Polyunsaturated fat
+339.7%