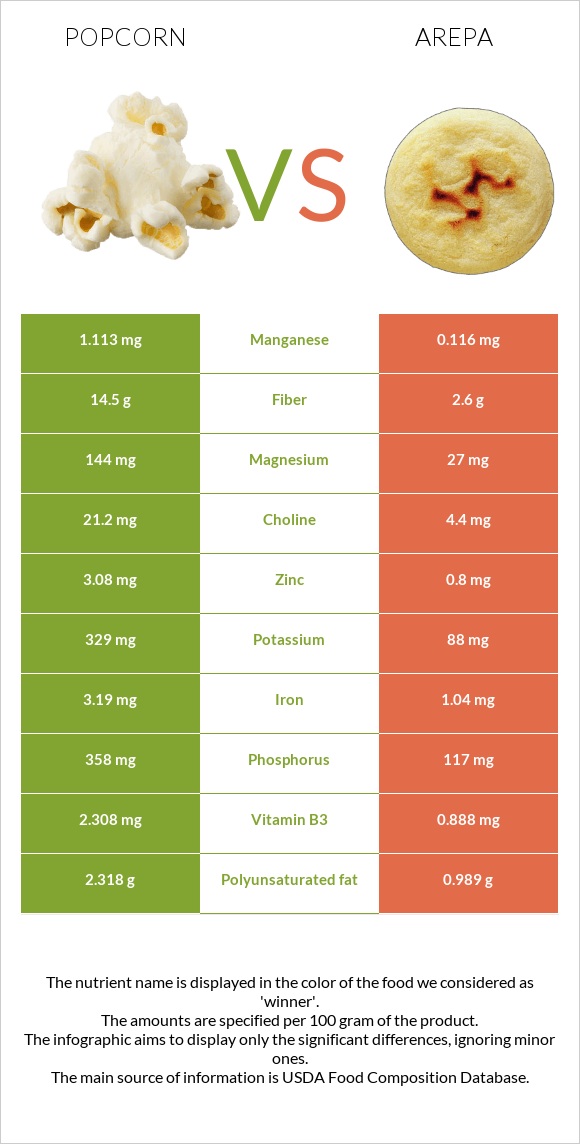
How are popcorn and arepa different? Popcorn is higher in fiber, manganese, phosphorus, magnesium, iron, copper, and zinc; however, arepa is richer in selenium. Daily need coverage for fiber for popcorn is 48% higher. Popcorn contains 10 times more manganese than arepa. While popcorn contains 1.113mg of manganese, arepa contains only 0.116mg. Popcorn has less saturated fat. Snacks, popcorn, air-popped and Restaurant, Latino, arepa (unleavened cornmeal bread) are the varieties used in this article.
Infographic
Mineral Comparison
Mineral comparison score is based on the number of minerals by which one or the other food is richer. The "coverage" charts below show how much of the daily needs can be covered by 300 grams of the food.
8
100 g
300 g
1 cup - 8g 1 oz - 28.35g
Magnesium
Magnesium
Calcium
Calcium
Potassium
Potassium
Iron
Iron
Copper
Copper
Zinc
Zinc
Phosphorus
Phosphorus
Sodium
Sodium
Manganese
Manganese
Selenium
Selenium
103%
2.1%
29%
120%
87%
84%
153%
1%
145%
0%
2
100 g
300 g
1 piece - 98g
Magnesium
Magnesium
Calcium
Calcium
Potassium
Potassium
Iron
Iron
Copper
Copper
Zinc
Zinc
Phosphorus
Phosphorus
Sodium
Sodium
Manganese
Manganese
Selenium
Selenium
19%
27%
7.8%
39%
10%
22%
50%
35%
15%
33%
Vitamin Comparison
Vitamin comparison score is based on the number of vitamins by which one or the other food is richer. The "coverage" charts below show how much of the daily needs can be covered by 300 grams of the food.
6
100 g
300 g
1 cup - 8g 1 oz - 28.35g
Vitamin C
Vit. C
Vitamin D
Vit. D
Vitamin A
Vit. A
Vitamin E
Vit. E
Vitamin B1
Vit. B1
Vitamin B2
Vit. B2
Vitamin B3
Vit. B3
Vitamin B5
Vit. B5
Vitamin B6
Vit. B6
Vitamin B12
Vit. B12
Vitamin K
Vit. K
Folate
Folate
0%
0%
3.3%
5.8%
26%
19%
43%
31%
36%
0%
3%
23%
2
100 g
300 g
1 piece - 98g
Vitamin C
Vit. C
Vitamin D
Vit. D
Vitamin A
Vit. A
Vitamin E
Vit. E
Vitamin B1
Vit. B1
Vitamin B2
Vit. B2
Vitamin B3
Vit. B3
Vitamin B5
Vit. B5
Vitamin B6
Vit. B6
Vitamin B12
Vit. B12
Vitamin K
Vit. K
Folate
Folate
0%
0%
20%
5.8%
18%
9.7%
17%
12%
25%
0%
8.8%
0%
All nutrients comparison - raw data values
Nutrient
DV% diff.
Fiber
14.5g
2.6g
48%
Manganese
1.113mg
0.116mg
43%
Phosphorus
358mg
117mg
34%
Magnesium
144mg
27mg
28%
Iron
3.19mg
1.04mg
27%
Copper
0.262mg
0.03mg
26%
Starch
54.4g
22%
Zinc
3.08mg
0.8mg
21%
Protein
12.94g
5.48g
15%
Carbs
77.78g
37.14g
14%
Sodium
8mg
270mg
11%
Selenium
0µg
6.1µg
11%
Saturated fat
0.637g
2.902g
10%
Vitamin B3
2.308mg
0.888mg
9%
Polyunsaturated fat
2.318g
0.989g
9%
Calories
387kcal
219kcal
8%
Calcium
7mg
89mg
8%
Folate
31µg
8%
Potassium
329mg
88mg
7%
Vitamin A
10µg
61µg
6%
Vitamin B5
0.51mg
0.202mg
6%
Vitamin B6
0.157mg
0.107mg
4%
Vitamin B1
0.104mg
0.07mg
3%
Vitamin B2
0.083mg
0.042mg
3%
Choline
21.2mg
4.4mg
3%
Cholesterol
0mg
5mg
2%
Vitamin K
1.2µg
3.5µg
2%
Fats
4.54g
5.38g
1%
Monounsaturated fat
0.95g
1.514g
1%
Protein per 100 calories
3.3g
2.5g
N/A
Calories per 10 g protein
299kcal
400kcal
N/A
Weight per 100 calories
26g
46g
N/A
Unsaturated / Saturated Fat ratio
5.1
0.86
N/A
Net carbs
63.28g
34.54g
N/A
Sugar
0.87g
0.87g
N/A
Vitamin E
0.29mg
0.29mg
0%
Trans fat
0.157g
N/A
Tryptophan
0.085mg
0.048mg
0%
Threonine
0.452mg
0.193mg
0%
Isoleucine
0.431mg
0.207mg
0%
Leucine
1.473mg
0.671mg
0%
Lysine
0.338mg
0.228mg
0%
Methionine
0.252mg
0.131mg
0%
Phenylalanine
0.59mg
0.276mg
0%
Valine
0.607mg
0.276mg
0%
Histidine
0.367mg
0.166mg
0%
Fructose
0.07g
0g
0%
Omega-3 - EPA
0g
0.003g
N/A
Omega-3 - ALA
0.065g
N/A
Omega-3 - DPA
0g
0.003g
N/A
Omega-6 - Gamma-linoleic acid
0g
0.002g
N/A
Omega-6 - Dihomo-gamma-linoleic acid
0.005g
N/A
Omega-6 - Eicosadienoic acid
0g
0.003g
N/A
Omega-6 - Linoleic acid
0.825g
N/A
Macronutrient Comparison
Macronutrient breakdown side-by-side comparison
3
13%
5%
78%
3%
Protein:
12.94 g
Fats:
4.54 g
Carbs:
77.78 g
Water:
3.32 g
Other:
1.42 g
2
5%
5%
37%
51%
Protein:
5.48 g
Fats:
5.38 g
Carbs:
37.14 g
Water:
50.8 g
Other:
1.2 g
Contains
more
Protein Protein
+136.1%
Contains
more
Carbs Carbs
+109.4%
Contains
more
Other Other
+18.3%
Contains
more
Fats Fats
+18.5%
Contains
more
Water Water
+1430.1%
Fat Type Comparison
Fat type breakdown side-by-side comparison
2
16%
24%
59%
Saturated fat:
Sat. Fat
0.637 g
Monounsaturated fat:
Mono. Fat
0.95 g
Polyunsaturated fat:
Poly. Fat
2.318 g
1
54%
28%
18%
Saturated fat:
Sat. Fat
2.902 g
Monounsaturated fat:
Mono. Fat
1.514 g
Polyunsaturated fat:
Poly. Fat
0.989 g
Contains
less
Sat. Fat Saturated fat
-78%
Contains
more
Poly. Fat Polyunsaturated fat
+134.4%
Contains
more
Mono. Fat Monounsaturated fat
+59.4%
Carbohydrate type comparison
Carbohydrate type breakdown side-by-side comparison
4
98%
Starch:
54.4 g
Sucrose:
0.72 g
Glucose:
0.07 g
Fructose:
0.07 g
Lactose:
0 g
Maltose:
0 g
Galactose:
0 g
1
45%
55%
Starch:
0 g
Sucrose:
0.33 g
Glucose:
0 g
Fructose:
0 g
Lactose:
0 g
Maltose:
0.41 g
Galactose:
0 g
Contains
more
Starch Starch
+∞%
Contains
more
Sucrose Sucrose
+118.2%
Contains
more
Glucose Glucose
+∞%
Contains
more
Fructose Fructose
+∞%
Contains
more
Maltose Maltose
+∞%
~equal in
Lactose
~0g
~equal in
Galactose
~0g