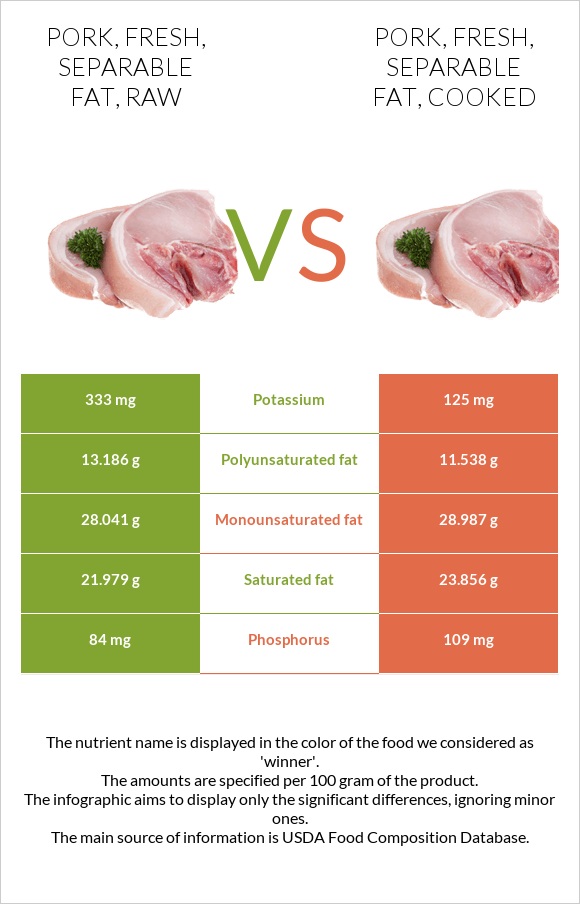
Pork raw vs cooked
Education:
Foodstruct Founder

Lte's test this thing
THis is the first subfood comparison

Infographic
Infographic link
Mineral Comparison
Mineral comparison score is based on the number of minerals by which one or the other food is richer. The "coverage" charts below show how much of the daily needs can be covered by 300 grams of the food.
| Contains more PotassiumPotassium | +166.4% |
| Contains less SodiumSodium | -16.1% |
| Contains more MagnesiumMagnesium | +50% |
| Contains more CalciumCalcium | +57.1% |
| Contains more IronIron | +76.9% |
| Contains more CopperCopper | +34.3% |
| Contains more ZincZinc | +25% |
| Contains more PhosphorusPhosphorus | +29.8% |
| Contains more ManganeseManganese | +∞% |
| Contains more SeleniumSelenium | +27.8% |
Vitamin Comparison
Vitamin comparison score is based on the number of vitamins by which one or the other food is richer. The "coverage" charts below show how much of the daily needs can be covered by 300 grams of the food.
| Contains more Vitamin EVitamin E | +∞% |
| Contains more Vitamin B12Vitamin B12 | +24.1% |
| Contains more Vitamin B1Vitamin B1 | +31.3% |
| Contains more Vitamin B2Vitamin B2 | +122.2% |
| Contains more Vitamin B3Vitamin B3 | +18.6% |
| Contains more Vitamin B5Vitamin B5 | +18.6% |
| Contains more Vitamin B6Vitamin B6 | +34.3% |
All nutrients comparison - raw data values
| Nutrient | |
|
DV% diff. |
| Polyunsaturated fat | 13.186g | 11.538g | 11% |
| Saturated fat | 21.979g | 23.856g | 9% |
| Vitamin B2 | 0.09mg | 0.2mg | 8% |
| Potassium | 333mg | 125mg | 6% |
| Selenium | 9µg | 11.5µg | 5% |
| Vitamin B12 | 0.67µg | 0.54µg | 5% |
| Protein | 9.25g | 7.06g | 4% |
| Phosphorus | 84mg | 109mg | 4% |
| Vitamin B1 | 0.16mg | 0.21mg | 4% |
| Vitamin B6 | 0.143mg | 0.192mg | 4% |
| Iron | 0.26mg | 0.46mg | 3% |
| Copper | 0.067mg | 0.09mg | 3% |
| Vitamin E | 0.42mg | 0mg | 3% |
| Vitamin B3 | 2.63mg | 3.12mg | 3% |
| Cholesterol | 72mg | 79mg | 2% |
| Vitamin B5 | 0.43mg | 0.51mg | 2% |
| Monounsaturated fat | 28.041g | 28.987g | 2% |
| Fats | 65.7g | 66.1g | 1% |
| Vitamin D | 1.7µg | 1.8µg | 1% |
| Magnesium | 6mg | 9mg | 1% |
| Calcium | 14mg | 22mg | 1% |
| Zinc | 0.6mg | 0.75mg | 1% |
| Calories | 632kcal | 626kcal | 0% |
| Protein per 100 calories | 1.5g | 1.1g | N/A |
| Calories per 10 g protein | 683kcal | 887kcal | N/A |
| Weight per 100 calories | 16g | 16g | N/A |
| Unsaturated / Saturated Fat ratio | 1.9 | 1.7 | N/A |
| Vitamin D* | 69 IU | 72 IU | 0% |
| Sodium | 47mg | 56mg | 0% |
| Vitamin A | 26µg | 24µg | 0% |
| Manganese | 0mg | 0.003mg | 0% |
| Trans fat | 0.6g | 0.475g | N/A |
| Choline | 31mg | 32.9mg | 0% |
| Tryptophan | 0.11mg | 0.084mg | 0% |
| Threonine | 0.407mg | 0.311mg | 0% |
| Isoleucine | 0.438mg | 0.334mg | 0% |
| Leucine | 0.761mg | 0.581mg | 0% |
| Lysine | 0.823mg | 0.628mg | 0% |
| Methionine | 0.254mg | 0.194mg | 0% |
| Phenylalanine | 0.384mg | 0.293mg | 0% |
| Valine | 0.468mg | 0.357mg | 0% |
| Histidine | 0.376mg | 0.287mg | 0% |
| Omega-3 - DHA | 0.021g | 0.016g | N/A |
| Omega-3 - ALA | 0.564g | 0.416g | N/A |
| Omega-3 - DPA | 0.046g | 0.04g | N/A |
| Omega-6 - Gamma-linoleic acid | 0.024g | 0.022g | N/A |
| Omega-6 - Eicosadienoic acid | 0.445g | 0.418g | N/A |
| Omega-6 - Linoleic acid | 11.7g | 10.3g | N/A |
Macronutrient Comparison
Macronutrient breakdown side-by-side comparison
Protein:
9.25 g
Fats:
65.7 g
Carbs:
0 g
Water:
24.76 g
Other:
0.29 g
Protein:
7.06 g
Fats:
66.1 g
Carbs:
0 g
Water:
26.26 g
Other:
0.58 g
| Contains more ProteinProtein | +31% |
| Contains more OtherOther | +100% |
~equal in
Fats
~66.1g
~equal in
Carbs
~0g
~equal in
Water
~26.26g
Fat Type Comparison
Fat type breakdown side-by-side comparison
Saturated fat:
Sat. Fat
21.979 g
Monounsaturated fat:
Mono. Fat
28.041 g
Polyunsaturated fat:
Poly. Fat
13.186 g
Saturated fat:
Sat. Fat
23.856 g
Monounsaturated fat:
Mono. Fat
28.987 g
Polyunsaturated fat:
Poly. Fat
11.538 g
| Contains more Poly. FatPolyunsaturated fat | +14.3% |
~equal in
Saturated fat
~23.856g
~equal in
Monounsaturated fat
~28.987g