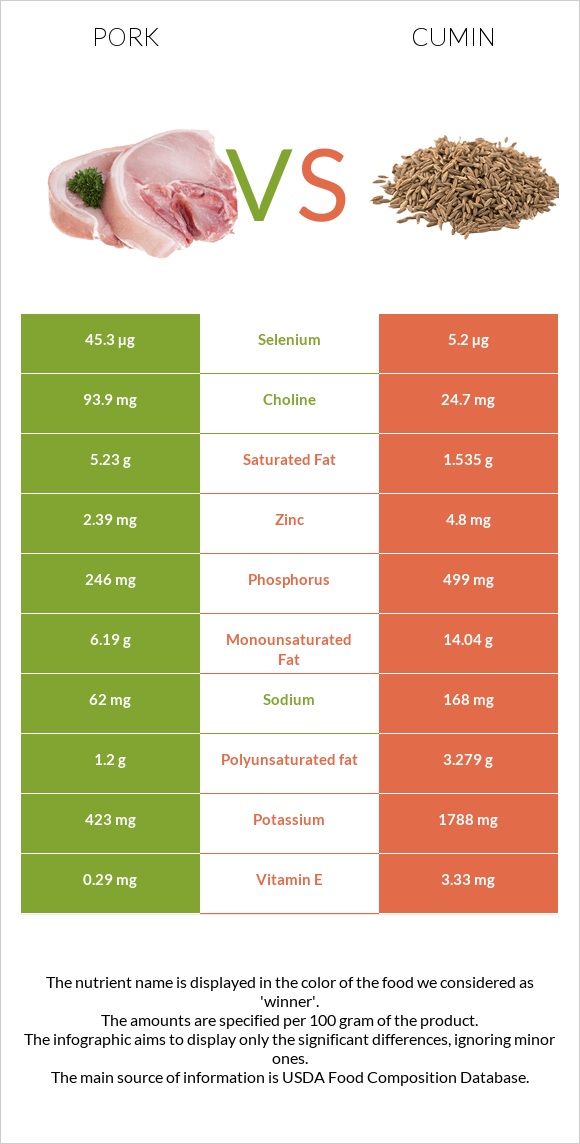
What are the main differences between pork and cumin? Pork is richer in selenium and vitamin B12, yet cumin is richer in iron, manganese, calcium, copper, magnesium, fiber, potassium, and phosphorus. Cumin's daily need coverage for iron is 819% higher. We used Pork, fresh, loin, whole, separable lean, and fat, cooked, broiled and Spices, cumin seed types in this comparison.
Infographic
Mineral Comparison
Mineral comparison score is based on the number of minerals by which one or the other food is richer. The "coverage" charts below show how much of the daily needs can be covered by 300 grams of the food.
2
100 g
300 g
3 oz - 85g 1 chop, excluding refuse (yield from 1 raw chop, with refuse, weighing 151 g) - 87g
Magnesium
Magnesium
Calcium
Calcium
Potassium
Potassium
Iron
Iron
Copper
Copper
Zinc
Zinc
Phosphorus
Phosphorus
Sodium
Sodium
Manganese
Manganese
Selenium
Selenium
20%
5.7%
37%
33%
24%
65%
105%
8.1%
1.2%
247%
8
100 g
300 g
0.25 tsp, whole - 0.5g 1 tbsp, whole - 6g
Magnesium
Magnesium
Calcium
Calcium
Potassium
Potassium
Iron
Iron
Copper
Copper
Zinc
Zinc
Phosphorus
Phosphorus
Sodium
Sodium
Manganese
Manganese
Selenium
Selenium
261%
279%
158%
2489%
289%
131%
214%
22%
435%
28%
Vitamin Comparison
Vitamin comparison score is based on the number of vitamins by which one or the other food is richer. The "coverage" charts below show how much of the daily needs can be covered by 300 grams of the food.
4
100 g
300 g
3 oz - 85g 1 chop, excluding refuse (yield from 1 raw chop, with refuse, weighing 151 g) - 87g
Vitamin C
Vit. C
Vitamin D
Vit. D
Vitamin A
Vit. A
Vitamin E
Vit. E
Vitamin B1
Vit. B1
Vitamin B2
Vit. B2
Vitamin B3
Vit. B3
Vitamin B5
Vit. B5
Vitamin B6
Vit. B6
Vitamin B12
Vit. B12
Vitamin K
Vit. K
Folate
Folate
2%
20%
0.67%
5.8%
219%
74%
94%
42%
107%
88%
0%
3.8%
5
100 g
300 g
0.25 tsp, whole - 0.5g 1 tbsp, whole - 6g
Vitamin C
Vit. C
Vitamin D
Vit. D
Vitamin A
Vit. A
Vitamin E
Vit. E
Vitamin B1
Vit. B1
Vitamin B2
Vit. B2
Vitamin B3
Vit. B3
Vitamin B5
Vit. B5
Vitamin B6
Vit. B6
Vitamin B12
Vit. B12
Vitamin K
Vit. K
Folate
Folate
26%
0%
21%
67%
157%
75%
86%
0%
100%
0%
14%
7.5%
All nutrients comparison - raw data values
Nutrient
DV% diff.
Iron
0.87mg
66.36mg
819%
Manganese
0.009mg
3.333mg
145%
Calcium
19mg
931mg
91%
Copper
0.073mg
0.867mg
88%
Magnesium
28mg
366mg
80%
Selenium
45.3µg
5.2µg
73%
Fiber
0g
10.5g
42%
Potassium
423mg
1788mg
40%
Phosphorus
246mg
499mg
36%
Vitamin B12
0.7µg
0µg
29%
Cholesterol
80mg
0mg
27%
Zinc
2.39mg
4.8mg
22%
Vitamin B1
0.877mg
0.628mg
21%
Vitamin E
0.29mg
3.33mg
20%
Monounsaturated fat
6.19g
14.04g
20%
Protein
27.32g
17.81g
19%
Saturated fat
5.23g
1.535g
17%
Carbs
0g
44.24g
15%
Vitamin B5
0.698mg
14%
Polyunsaturated fat
1.2g
3.279g
14%
Fats
13.92g
22.27g
13%
Choline
93.9mg
24.7mg
13%
Vitamin C
0.6mg
7.7mg
8%
Calories
242kcal
375kcal
7%
Vitamin D*
53 IU
0 IU
7%
Vitamin D
1.3µg
0µg
7%
Vitamin A
2µg
64µg
7%
Sodium
62mg
168mg
5%
Vitamin K
0µg
5.4µg
5%
Vitamin B3
5.037mg
4.579mg
3%
Vitamin B6
0.464mg
0.435mg
2%
Folate
5µg
10µg
1%
Protein per 100 calories
11g
4.7g
N/A
Calories per 10 g protein
89kcal
211kcal
N/A
Weight per 100 calories
41g
27g
N/A
Unsaturated / Saturated Fat ratio
1.4
11
N/A
Net carbs
0g
33.74g
N/A
Sugar
0g
2.25g
N/A
Vitamin B2
0.321mg
0.327mg
0%
Tryptophan
0.338mg
0%
Threonine
1.234mg
0%
Isoleucine
1.26mg
0%
Leucine
2.177mg
0%
Lysine
2.446mg
0%
Methionine
0.712mg
0%
Phenylalanine
1.086mg
0%
Valine
1.473mg
0%
Histidine
1.067mg
0%
Macronutrient Comparison
Macronutrient breakdown side-by-side comparison
2
27%
14%
58%
Protein:
27.32 g
Fats:
13.92 g
Carbs:
0 g
Water:
57.87 g
Other:
0.89 g
3
18%
22%
44%
8%
8%
Protein:
17.81 g
Fats:
22.27 g
Carbs:
44.24 g
Water:
8.06 g
Other:
7.62 g
Contains
more
Protein Protein
+53.4%
Contains
more
Water Water
+618%
Contains
more
Fats Fats
+60%
Contains
more
Carbs Carbs
+∞%
Contains
more
Other Other
+756.2%
Fat Type Comparison
Fat type breakdown side-by-side comparison
0
41%
49%
10%
Saturated fat:
Sat. Fat
5.23 g
Monounsaturated fat:
Mono. Fat
6.19 g
Polyunsaturated fat:
Poly. Fat
1.2 g
3
8%
74%
17%
Saturated fat:
Sat. Fat
1.535 g
Monounsaturated fat:
Mono. Fat
14.04 g
Polyunsaturated fat:
Poly. Fat
3.279 g
Contains
less
Sat. Fat Saturated fat
-70.7%
Contains
more
Mono. Fat Monounsaturated fat
+126.8%
Contains
more
Poly. Fat Polyunsaturated fat
+173.3%