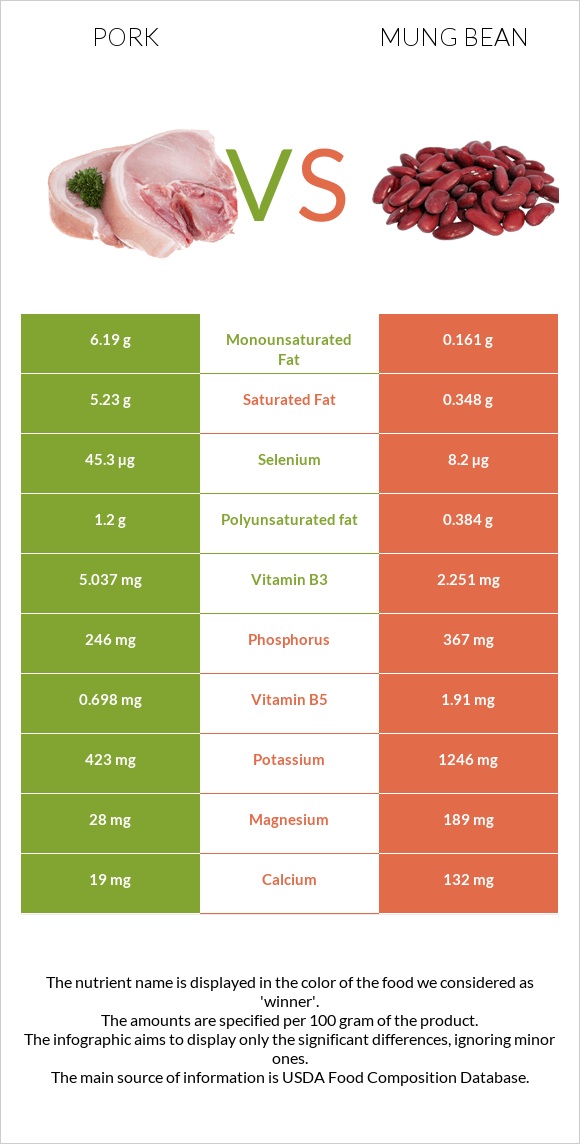
Important differences between pork and mung beans Pork has more selenium and vitamin B12; however, mung beans are richer in folate, copper, iron, fiber, manganese, and magnesium. Mung beans' daily need coverage for folate is 155% more. Mung beans contain less cholesterol. Mung beans have a higher glycemic index. The glycemic index of mung beans is 31, while the glycemic index of pork is 0. The food varieties used in the comparison are Pork, fresh, loin, whole, separable lean, and fat, cooked, broiled and Mung beans, mature seeds, raw .
Infographic
Mineral Comparison
Mineral comparison score is based on the number of minerals by which one or the other food is richer. The "coverage" charts below show how much of the daily needs can be covered by 300 grams of the food.
1
100 g
300 g
3 oz - 85g 1 chop, excluding refuse (yield from 1 raw chop, with refuse, weighing 151 g) - 87g
Magnesium
Magnesium
Calcium
Calcium
Potassium
Potassium
Iron
Iron
Copper
Copper
Zinc
Zinc
Phosphorus
Phosphorus
Sodium
Sodium
Manganese
Manganese
Selenium
Selenium
20%
5.7%
37%
33%
24%
65%
105%
8.1%
1.2%
247%
9
100 g
300 g
1 tbsp - 13g 1 cup - 207g
Magnesium
Magnesium
Calcium
Calcium
Potassium
Potassium
Iron
Iron
Copper
Copper
Zinc
Zinc
Phosphorus
Phosphorus
Sodium
Sodium
Manganese
Manganese
Selenium
Selenium
135%
40%
110%
253%
314%
73%
157%
2%
135%
45%
Vitamin Comparison
Vitamin comparison score is based on the number of vitamins by which one or the other food is richer. The "coverage" charts below show how much of the daily needs can be covered by 300 grams of the food.
6
100 g
300 g
3 oz - 85g 1 chop, excluding refuse (yield from 1 raw chop, with refuse, weighing 151 g) - 87g
Vitamin C
Vit. C
Vitamin D
Vit. D
Vitamin A
Vit. A
Vitamin E
Vit. E
Vitamin B1
Vit. B1
Vitamin B2
Vit. B2
Vitamin B3
Vit. B3
Vitamin B5
Vit. B5
Vitamin B6
Vit. B6
Vitamin B12
Vit. B12
Vitamin K
Vit. K
Folate
Folate
2%
20%
0.67%
5.8%
219%
74%
94%
42%
107%
88%
0%
3.8%
6
100 g
300 g
1 tbsp - 13g 1 cup - 207g
Vitamin C
Vit. C
Vitamin D
Vit. D
Vitamin A
Vit. A
Vitamin E
Vit. E
Vitamin B1
Vit. B1
Vitamin B2
Vit. B2
Vitamin B3
Vit. B3
Vitamin B5
Vit. B5
Vitamin B6
Vit. B6
Vitamin B12
Vit. B12
Vitamin K
Vit. K
Folate
Folate
16%
0%
2%
10%
155%
54%
42%
115%
88%
0%
23%
469%
All nutrients comparison - raw data values
Nutrient
DV% diff.
Folate
5µg
625µg
155%
Copper
0.073mg
0.941mg
96%
Iron
0.87mg
6.74mg
73%
Selenium
45.3µg
8.2µg
67%
Fiber
0g
16.3g
65%
Manganese
0.009mg
1.035mg
45%
Magnesium
28mg
189mg
38%
Vitamin B12
0.7µg
0µg
29%
Cholesterol
80mg
0mg
27%
Potassium
423mg
1246mg
24%
Vitamin B5
0.698mg
1.91mg
24%
Saturated fat
5.23g
0.348g
22%
Carbs
0g
62.62g
21%
Vitamin B1
0.877mg
0.621mg
21%
Fats
13.92g
1.15g
20%
Phosphorus
246mg
367mg
17%
Vitamin B3
5.037mg
2.251mg
17%
Monounsaturated fat
6.19g
0.161g
15%
Calcium
19mg
132mg
11%
Vitamin K
0µg
9µg
8%
Protein
27.32g
23.86g
7%
Vitamin D*
53 IU
0 IU
7%
Vitamin D
1.3µg
0µg
7%
Vitamin B2
0.321mg
0.233mg
7%
Vitamin B6
0.464mg
0.382mg
6%
Calories
242kcal
347kcal
5%
Vitamin C
0.6mg
4.8mg
5%
Polyunsaturated fat
1.2g
0.384g
5%
Zinc
2.39mg
2.68mg
3%
Sodium
62mg
15mg
2%
Vitamin E
0.29mg
0.51mg
1%
Choline
93.9mg
97.9mg
1%
Protein per 100 calories
11g
6.9g
N/A
Calories per 10 g protein
89kcal
145kcal
N/A
Weight per 100 calories
41g
29g
N/A
Unsaturated / Saturated Fat ratio
1.4
1.6
N/A
Net carbs
0g
46.32g
N/A
Sugar
0g
6.6g
N/A
Vitamin A
2µg
6µg
0%
Tryptophan
0.338mg
0.26mg
0%
Threonine
1.234mg
0.782mg
0%
Isoleucine
1.26mg
1.008mg
0%
Leucine
2.177mg
1.847mg
0%
Lysine
2.446mg
1.664mg
0%
Methionine
0.712mg
0.286mg
0%
Phenylalanine
1.086mg
1.443mg
0%
Valine
1.473mg
1.237mg
0%
Histidine
1.067mg
0.695mg
0%
Macronutrient Comparison
Macronutrient breakdown side-by-side comparison
3
27%
14%
58%
Protein:
27.32 g
Fats:
13.92 g
Carbs:
0 g
Water:
57.87 g
Other:
0.89 g
2
24%
63%
9%
3%
Protein:
23.86 g
Fats:
1.15 g
Carbs:
62.62 g
Water:
9.05 g
Other:
3.32 g
Contains
more
Protein Protein
+14.5%
Contains
more
Fats Fats
+1110.4%
Contains
more
Water Water
+539.4%
Contains
more
Carbs Carbs
+∞%
Contains
more
Other Other
+273%
Fat Type Comparison
Fat type breakdown side-by-side comparison
2
41%
49%
10%
Saturated fat:
Sat. Fat
5.23 g
Monounsaturated fat:
Mono. Fat
6.19 g
Polyunsaturated fat:
Poly. Fat
1.2 g
1
39%
18%
43%
Saturated fat:
Sat. Fat
0.348 g
Monounsaturated fat:
Mono. Fat
0.161 g
Polyunsaturated fat:
Poly. Fat
0.384 g
Contains
more
Mono. Fat Monounsaturated fat
+3744.7%
Contains
more
Poly. Fat Polyunsaturated fat
+212.5%
Contains
less
Sat. Fat Saturated fat
-93.3%