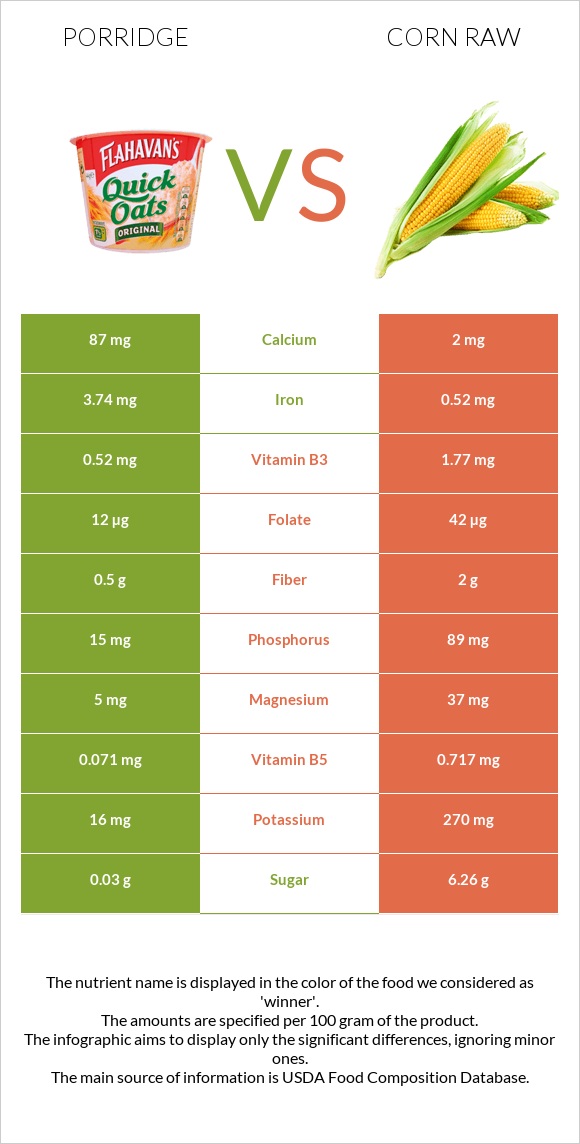
Significant differences between porridge and corn raw Porridge has more iron and calcium; however, corn raw is richer in vitamin B5, phosphorus, vitamin B1, vitamin B3, magnesium, vitamin C, folate, and potassium. Porridge covers your daily iron needs 40% more than corn raw. Corn raw has 44 times less calcium than porridge. Porridge has 87mg of calcium, while corn raw has 2mg. Porridge has a higher glycemic index. The glycemic index of porridge is 66, while the glycemic index of corn raw is 52. Specific food types used in this comparison are Cereals, CREAM OF WHEAT, regular (10 minute), cooked with water, without salt and Corn, sweet, yellow, raw .
Infographic
Mineral Comparison
Mineral comparison score is based on the number of minerals by which one or the other food is richer. The "coverage" charts below show how much of the daily needs can be covered by 300 grams of the food.
4
100 g
300 g
1 tbsp - 16g 1 cup (1 serving) - 251g
Magnesium
Magnesium
Calcium
Calcium
Potassium
Potassium
Iron
Iron
Copper
Copper
Zinc
Zinc
Phosphorus
Phosphorus
Sodium
Sodium
Manganese
Manganese
Selenium
Selenium
3.6%
26%
1.4%
140%
13%
3.5%
6.4%
0.78%
0%
15%
6
100 g
300 g
1 ear, small (5-1/2" to 6-1/2" long) - 73g 1 ear, medium (6-3/4" to 7-1/2" long) yields - 102g 1 ear, large (7-3/4" to 9" long) yields - 143g 1 cup - 145g
Magnesium
Magnesium
Calcium
Calcium
Potassium
Potassium
Iron
Iron
Copper
Copper
Zinc
Zinc
Phosphorus
Phosphorus
Sodium
Sodium
Manganese
Manganese
Selenium
Selenium
26%
0.6%
24%
20%
18%
13%
38%
2%
21%
3.3%
Vitamin Comparison
Vitamin comparison score is based on the number of vitamins by which one or the other food is richer. The "coverage" charts below show how much of the daily needs can be covered by 300 grams of the food.
0
100 g
300 g
1 tbsp - 16g 1 cup (1 serving) - 251g
Vitamin C
Vit. C
Vitamin D
Vit. D
Vitamin A
Vit. A
Vitamin E
Vit. E
Vitamin B1
Vit. B1
Vitamin B2
Vit. B2
Vitamin B3
Vit. B3
Vitamin B5
Vit. B5
Vitamin B6
Vit. B6
Vitamin B12
Vit. B12
Vitamin K
Vit. K
Folate
Folate
0%
0%
0%
0.4%
14%
5.8%
9.8%
4.3%
3%
0%
0.25%
9%
10
100 g
300 g
1 ear, small (5-1/2" to 6-1/2" long) - 73g 1 ear, medium (6-3/4" to 7-1/2" long) yields - 102g 1 ear, large (7-3/4" to 9" long) yields - 143g 1 cup - 145g
Vitamin C
Vit. C
Vitamin D
Vit. D
Vitamin A
Vit. A
Vitamin E
Vit. E
Vitamin B1
Vit. B1
Vitamin B2
Vit. B2
Vitamin B3
Vit. B3
Vitamin B5
Vit. B5
Vitamin B6
Vit. B6
Vitamin B12
Vit. B12
Vitamin K
Vit. K
Folate
Folate
23%
0%
3%
1.4%
39%
13%
33%
43%
21%
0%
0.75%
32%
All nutrients comparison - raw data values
Nutrient
DV% diff.
Iron
3.74mg
0.52mg
40%
Vitamin B5
0.071mg
0.717mg
13%
Phosphorus
15mg
89mg
11%
Calcium
87mg
2mg
9%
Vitamin C
0mg
6.8mg
8%
Magnesium
5mg
37mg
8%
Vitamin B1
0.055mg
0.155mg
8%
Vitamin B3
0.52mg
1.77mg
8%
Folate
12µg
42µg
8%
Potassium
16mg
270mg
7%
Manganese
0mg
0.163mg
7%
Fiber
0.5g
2g
6%
Vitamin B6
0.013mg
0.093mg
6%
Protein
1.44g
3.27g
4%
Selenium
2.8µg
0.6µg
4%
Choline
23mg
4%
Carbs
10.52g
18.7g
3%
Zinc
0.13mg
0.46mg
3%
Calories
50kcal
86kcal
2%
Fats
0.21g
1.35g
2%
Copper
0.04mg
0.054mg
2%
Starch
5.7g
2%
Vitamin B2
0.025mg
0.055mg
2%
Polyunsaturated fat
0.114g
0.487g
2%
Fructose
1.94g
2%
Vitamin A
0µg
9µg
1%
Saturated fat
0.033g
0.325g
1%
Monounsaturated fat
0.028g
0.432g
1%
Protein per 100 calories
2.9g
3.8g
N/A
Calories per 10 g protein
347kcal
263kcal
N/A
Weight per 100 calories
200g
116g
N/A
Net carbs
10.02g
16.7g
N/A
Sugar
0.03g
6.26g
N/A
Sodium
6mg
15mg
0%
Vitamin E
0.02mg
0.07mg
0%
Vitamin K
0.1µg
0.3µg
0%
Tryptophan
0.02mg
0.023mg
0%
Threonine
0.045mg
0.129mg
0%
Isoleucine
0.063mg
0.129mg
0%
Leucine
0.11mg
0.348mg
0%
Lysine
0.037mg
0.137mg
0%
Methionine
0.027mg
0.067mg
0%
Phenylalanine
0.078mg
0.15mg
0%
Valine
0.07mg
0.185mg
0%
Histidine
0.033mg
0.089mg
0%
Omega-3 - ALA
0.014g
N/A
Omega-6 - Linoleic acid
0.468g
N/A
Macronutrient Comparison
Macronutrient breakdown side-by-side comparison
1
11%
88%
Protein:
1.44 g
Fats:
0.21 g
Carbs:
10.52 g
Water:
87.61 g
Other:
0.22 g
4
3%
19%
76%
Protein:
3.27 g
Fats:
1.35 g
Carbs:
18.7 g
Water:
76.05 g
Other:
0.63 g
Contains
more
Water Water
+15.2%
Contains
more
Protein Protein
+127.1%
Contains
more
Fats Fats
+542.9%
Contains
more
Carbs Carbs
+77.8%
Contains
more
Other Other
+186.4%
Fat Type Comparison
Fat type breakdown side-by-side comparison
1
19%
16%
65%
Saturated fat:
Sat. Fat
0.033 g
Monounsaturated fat:
Mono. Fat
0.028 g
Polyunsaturated fat:
Poly. Fat
0.114 g
2
26%
35%
39%
Saturated fat:
Sat. Fat
0.325 g
Monounsaturated fat:
Mono. Fat
0.432 g
Polyunsaturated fat:
Poly. Fat
0.487 g
Contains
less
Sat. Fat Saturated fat
-89.8%
Contains
more
Mono. Fat Monounsaturated fat
+1442.9%
Contains
more
Poly. Fat Polyunsaturated fat
+327.2%