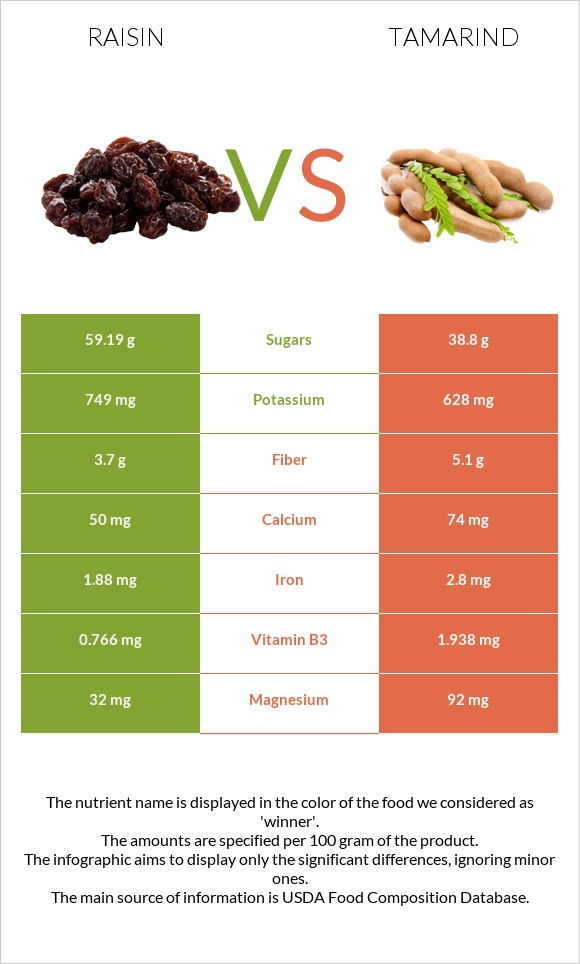
Significant differences between raisins and tamarind Raisins have more copper and vitamin B6; however, tamarind is richer in vitamin B1, magnesium, iron, vitamin B3, and fiber. Tamarind covers your daily vitamin B1 needs 27% more than raisins. Tamarind has 4 times less copper than raisins. Raisins have 0.318mg of copper, while tamarind has 0.086mg. Tamarind contains less sugar. Raisins have a higher glycemic index. The glycemic index of raisins is 64, while the glycemic index of tamarind is 23. Specific food types used in this comparison are Raisins, seedless and Tamarinds, raw .
Infographic
Mineral Comparison
Mineral comparison score is based on the number of minerals by which one or the other food is richer. The "coverage" charts below show how much of the daily needs can be covered by 300 grams of the food.
5
100 g
300 g
1 miniature box (.5 oz) - 14g 50 raisins - 26g 1 oz (60 raisins) - 28.35g 1 small box (1.5 oz) - 43g 1 cup (not packed) - 145g 1 cup, packed - 165g
Magnesium
Magnesium
Calcium
Calcium
Potassium
Potassium
Iron
Iron
Copper
Copper
Zinc
Zinc
Phosphorus
Phosphorus
Sodium
Sodium
Manganese
Manganese
Selenium
Selenium
23%
15%
66%
71%
106%
6%
43%
1.4%
39%
3.3%
5
100 g
300 g
1 fruit (3" x 1") - 2g 1 cup, pulp - 120g
Magnesium
Magnesium
Calcium
Calcium
Potassium
Potassium
Iron
Iron
Copper
Copper
Zinc
Zinc
Phosphorus
Phosphorus
Sodium
Sodium
Manganese
Manganese
Selenium
Selenium
66%
22%
55%
105%
29%
2.7%
48%
3.7%
0%
7.1%
Vitamin Comparison
Vitamin comparison score is based on the number of vitamins by which one or the other food is richer. The "coverage" charts below show how much of the daily needs can be covered by 300 grams of the food.
3
100 g
300 g
1 miniature box (.5 oz) - 14g 50 raisins - 26g 1 oz (60 raisins) - 28.35g 1 small box (1.5 oz) - 43g 1 cup (not packed) - 145g 1 cup, packed - 165g
Vitamin C
Vit. C
Vitamin D
Vit. D
Vitamin A
Vit. A
Vitamin E
Vit. E
Vitamin B1
Vit. B1
Vitamin B2
Vit. B2
Vitamin B3
Vit. B3
Vitamin B5
Vit. B5
Vitamin B6
Vit. B6
Vitamin B12
Vit. B12
Vitamin K
Vit. K
Folate
Folate
7.7%
0%
0%
2.4%
27%
29%
14%
5.7%
40%
0%
8.8%
3.8%
7
100 g
300 g
1 fruit (3" x 1") - 2g 1 cup, pulp - 120g
Vitamin C
Vit. C
Vitamin D
Vit. D
Vitamin A
Vit. A
Vitamin E
Vit. E
Vitamin B1
Vit. B1
Vitamin B2
Vit. B2
Vitamin B3
Vit. B3
Vitamin B5
Vit. B5
Vitamin B6
Vit. B6
Vitamin B12
Vit. B12
Vitamin K
Vit. K
Folate
Folate
12%
0%
0.67%
2%
107%
35%
36%
8.6%
15%
0%
7%
11%
All nutrients comparison - raw data values
Nutrient
DV% diff.
Fructose
29.68g
37%
Vitamin B1
0.106mg
0.428mg
27%
Copper
0.318mg
0.086mg
26%
Magnesium
32mg
92mg
14%
Manganese
0.299mg
13%
Iron
1.88mg
2.8mg
12%
Vitamin B6
0.174mg
0.066mg
8%
Vitamin B3
0.766mg
1.938mg
7%
Carbs
79.18g
62.5g
6%
Fiber
3.7g
5.1g
6%
Potassium
749mg
628mg
4%
Calories
299kcal
239kcal
3%
Calcium
50mg
74mg
2%
Phosphorus
101mg
113mg
2%
Vitamin B2
0.125mg
0.152mg
2%
Folate
5µg
14µg
2%
Protein
3.07g
2.8g
1%
Vitamin C
2.3mg
3.5mg
1%
Zinc
0.22mg
0.1mg
1%
Starch
2.7g
1%
Sodium
11mg
28mg
1%
Selenium
0.6µg
1.3µg
1%
Vitamin B5
0.095mg
0.143mg
1%
Vitamin K
3.5µg
2.8µg
1%
Saturated fat
0.058g
0.272g
1%
Protein per 100 calories
1g
1.2g
N/A
Calories per 10 g protein
974kcal
854kcal
N/A
Weight per 100 calories
33g
42g
N/A
Fats
0.46g
0.6g
0%
Net carbs
75.48g
57.4g
N/A
Sugar
59.19g
38.8g
N/A
Vitamin A
0µg
2µg
0%
Vitamin E
0.12mg
0.1mg
0%
Choline
11.1mg
8.6mg
0%
Monounsaturated fat
0.051g
0.181g
0%
Polyunsaturated fat
0.037g
0.059g
0%
Tryptophan
0.05mg
0.018mg
0%
Threonine
0.077mg
0%
Isoleucine
0.057mg
0%
Leucine
0.096mg
0%
Lysine
0.084mg
0.139mg
0%
Methionine
0.021mg
0.014mg
0%
Phenylalanine
0.065mg
0%
Valine
0.083mg
0%
Histidine
0.072mg
0%
Omega-6 - Gamma-linoleic acid
0.001g
N/A
Macronutrient Comparison
Macronutrient breakdown side-by-side comparison
2
3%
79%
15%
2%
Protein:
3.07 g
Fats:
0.46 g
Carbs:
79.18 g
Water:
15.43 g
Other:
1.86 g
3
3%
63%
31%
3%
Protein:
2.8 g
Fats:
0.6 g
Carbs:
62.5 g
Water:
31.4 g
Other:
2.7 g
Contains
more
Carbs Carbs
+26.7%
Contains
more
Fats Fats
+30.4%
Contains
more
Water Water
+103.5%
Contains
more
Other Other
+45.2%
Fat Type Comparison
Fat type breakdown side-by-side comparison
1
40%
35%
25%
Saturated fat:
Sat. Fat
0.058 g
Monounsaturated fat:
Mono. Fat
0.051 g
Polyunsaturated fat:
Poly. Fat
0.037 g
2
53%
35%
12%
Saturated fat:
Sat. Fat
0.272 g
Monounsaturated fat:
Mono. Fat
0.181 g
Polyunsaturated fat:
Poly. Fat
0.059 g
Contains
less
Sat. Fat Saturated fat
-78.7%
Contains
more
Mono. Fat Monounsaturated fat
+254.9%
Contains
more
Poly. Fat Polyunsaturated fat
+59.5%