Tamarind nutrition: calories, carbs, GI, protein, fiber, fats
Top nutrition facts for Tamarind
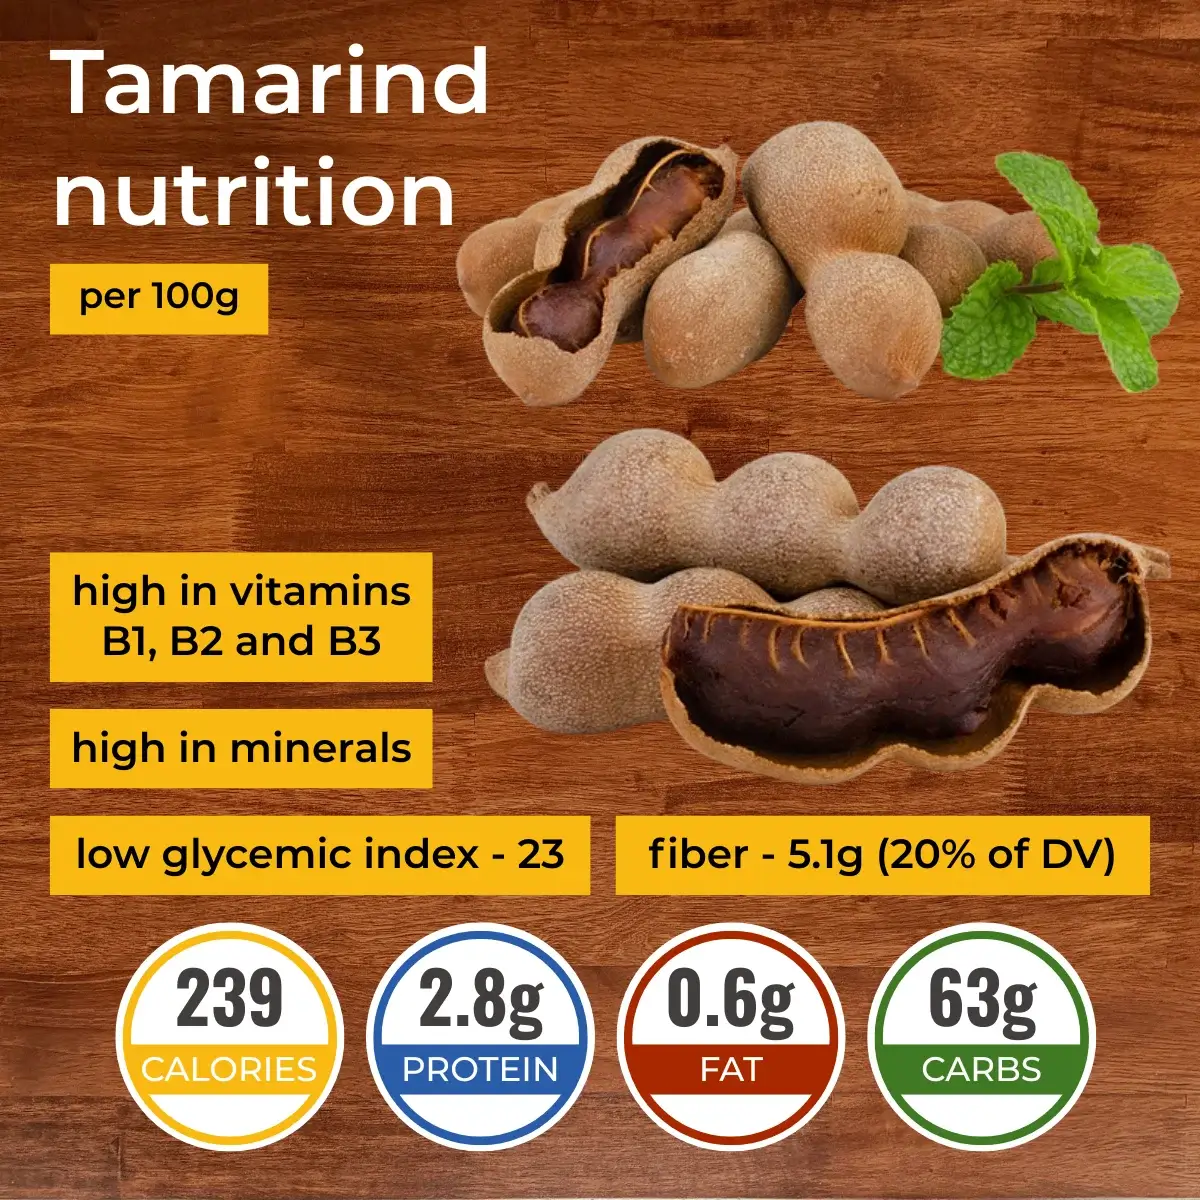
| Calories ⓘ Calories for selected serving | 239 kcal |
|
Glycemic index ⓘ
Source:
Check out our Glycemic index chart page for the full list.
|
23 (low) |
| Glycemic load ⓘ Glycemic Load (GL) is a metric that measures both the quality (Glycemic Index) and quantity of carbohydrates in a specific serving of food to estimate its impact on blood sugar levels. It is calculated as: (GI × Carbs in grams) / 100. | 16 (medium) |
| Net carbs ⓘ Net Carbs = Total Carbohydrates – Fiber – Sugar Alcohols | 57 g |
| Default serving size ⓘ Serving sizes are mostly taken from FDA's Reference Amounts Customarily Consumed (RACCs) | 1 cup, pulp (120 g) |
| Acidity (Based on PRAL) ⓘ PRAL (Potential renal acid load) is calculated using a formula. On the PRAL scale the higher the positive value, the more is the acidifying effect on the body. The lower the negative value, the higher the alkalinity of the food. 0 is neutral. | -11 (alkaline) |
| Oxalates | 6 mg ⓘ https://www.researchgate.net/publication/259133562 |

Carbs in Tamarind
Tamarind is a sweet leguminous tree fruit. It means it is a carbohydrate-rich food. 100g of Tamarind provides 62.5g of carbs or 21% of the daily carbohydrate needs.
So, if you were in Africa and found only Tamarinds, you would have to eat 440g of it to meet your daily requirements.
Macronutrients chart
Carbs per serving size
The Tamarind is served in one cup (120g). This quantity of fruit contains 75g of carbs.
Different Types
The carbs below are presented for 100g of tamarind different products using the USDA’s data source (1, 2).
| Carbs per 100g | |
| Tamarind Candies | 92g |
| Canned tamarind nectar | 14.7g |
Carbohydrate type breakdown
In 100g of Tamarind, 38.8g of carbs are sugars. The fiber content of this food equals 5.1g per 100g.
Soluble or insoluble fiber
According to study (3), dietary fiber components of Tamarind are lignin, cellulose, and hemicellulose. These three are insoluble fiber molecules that support bowel health.
Fiber content ratio for Tamarind
Tamarind net carbs
We can calculate the net carbs of Tamarind by subtracting the fiber content from the total carbs.
Tamarind contains 62.5g carbs, 5.1g of which is dietary fiber. Therefore, net carbs in Tamarind are 57.4g per 100g of fruit.
Tamarind calories
100g of Tamarind has 239 calories in it. It is an average-calorie food. These calories probably come from the 62.5g carb and 2.8g protein content of Tamarind. 100g of this fruit covers 12% of the daily calorie needs.
Calories per serving size
The serving size for Tamarind is one cup pulp (120g). This amount has 287 calories in it.
Comparison
Tamarind is higher in calories than 60% of foods.
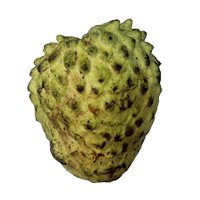
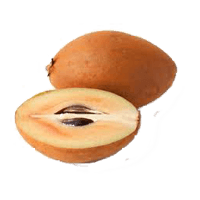
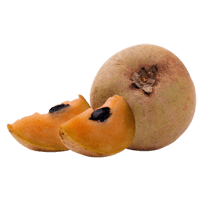
Tamarind is significantly higher in calories than Soursop. It has more calories than Sapodilla and Mamey Sapote.
The calorie content of Tamarind and some other foods is shown in the table below.
| Food | Calories per 100 grams |
| Tamarind | 239 |
| Mamey Sapote | 124 |
| Sapodilla | 83 |
| Soursop | 66 |
| Garden rhubarb | 21 |
Burning estimates
The table below illustrates how long it takes to burn 287 calories (1 cup of Tamarind) and the recommended type of activity. The period was estimated using the MET technique (Metabolic Equivalent of a Task) (4) (5).
| 1 cup - 70kg person | 1 cup - 100 kg person | |
| Walking | 71 min | 49 min |
| Cycling | 33 min | 23 min |
| Running | 36 min | 25 min |
REFERENCES
- https://fdc.nal.usda.gov/fdc-app.html#/food-details/170281/nutrients
- https://fdc.nal.usda.gov/fdc-app.html#/food-details/167786/nutrients
- https://www.researchgate.net/publication/272340454
- https://www.ncbi.nlm.nih.gov/pmc/articles/PMC4428382/
- 2011 Compendium of Physical Activities

Tamarind calories (kcal)
| Calories for different serving sizes of tamarind | Calories | Weight |
|---|---|---|
| Calories in 100 grams | 239 | |
| Calories in 1 cup, pulp | 287 | 120 g |
Extra Nutrition facts for Tamarind
| Protein per 100 calories ⓘ Shows how many grams of protein you get from 100 calories of this food, calculated as (protein in g ÷ calories) × 100. | 1.2 g |
| Calories per 10 g protein ⓘ Shows how many calories you need to eat from this food to get 10 g of protein, calculated as (calories ÷ protein in g) × 10. | 854 kcal |
| Weight per 100 calories ⓘ Shows how many grams of this food equal 100 kcal—higher grams mean a larger portion for the same calories. | 42 g |
Tamarind Glycemic index (GI)
Tamarind Glycemic load (GL)
Mineral coverage chart
Mineral chart - relative view
Vitamin coverage chart
Vitamin chart - relative view
Protein quality breakdown
Fat type information
All nutrients for Tamarind per 100g
| Nutrient | Value | DV% | In TOP % of foods | Comparison |
| Vitamin A | 2µg | 0% | 51% | |
| Calories | 239kcal | 12% | 40% |
5.1 times more than Orange
|
| Protein per 100 calories | 1.2g | N/A | 83% | |
| Calories per 10 g protein | 854kcal | N/A | 14% | |
| Protein | 2.8g | 7% | 73% |
Equal to Broccoli
|
| Weight per 100 calories | 42g | N/A | 60% | |
| Fats | 0.6g | 1% | 79% |
55.5 times less than Cheese
|
| Vitamin C | 3.5mg | 4% | 23% |
15.1 times less than Lemon
|
| Carbs | 63g | 21% | 16% |
2.2 times more than Rice
|
| Net carbs | 57g | N/A | 15% |
1.1 times more than Chocolate
|
| Cholesterol | 0mg | 0% | 100% |
N/A
|
| Vitamin D* | 0 IU | 0% | 100% |
N/A
|
| Vitamin D | 0µg | 0% | 100% |
N/A
|
| Magnesium | 92mg | 22% | 7% |
1.5 times less than Almonds
|
| Calcium | 74mg | 7% | 23% |
1.7 times less than Milk
|
| Potassium | 628mg | 18% | 5% |
4.3 times more than Cucumber
|
| Iron | 2.8mg | 35% | 22% |
1.1 times more than Beef broiled
|
| Sugar | 39g | N/A | 5% |
4.3 times more than Coca-Cola
|
| Fiber | 5.1g | 20% | 12% |
2.1 times more than Orange
|
| Copper | 0.09mg | 10% | 45% |
1.7 times less than Shiitake
|
| Zinc | 0.1mg | 1% | 83% |
63.1 times less than Beef broiled
|
| Phosphorus | 113mg | 16% | 55% |
1.6 times less than Chicken meat
|
| Sodium | 28mg | 1% | 78% |
17.5 times less than White bread
|
| Vitamin E | 0.1mg | 1% | 54% |
14.6 times less than Kiwi
|
| Selenium | 1.3µg | 2% | 61% | |
| Vitamin B1 | 0.43mg | 36% | 13% |
1.6 times more than Pea raw
|
| Vitamin B2 | 0.15mg | 12% | 50% |
1.2 times more than Avocado
|
| Vitamin B3 | 1.9mg | 12% | 52% |
4.9 times less than Turkey meat
|
| Vitamin B5 | 0.14mg | 3% | 60% |
7.9 times less than Sunflower seeds
|
| Vitamin B6 | 0.07mg | 5% | 64% |
1.8 times less than Oats
|
| Vitamin B12 | 0µg | 0% | 100% |
N/A
|
| Vitamin K | 2.8µg | 2% | 21% |
36.3 times less than Broccoli
|
| Trans fat | 0g | N/A | 100% |
N/A
|
| Folate | 14µg | 4% | 41% |
4.4 times less than Brussels sprouts
|
| Choline | 8.6mg | 2% | 42% | |
| Saturated fat | 0.27g | 1% | 71% |
21.7 times less than Beef broiled
|
| Monounsaturated fat | 0.18g | N/A | 72% |
54.1 times less than Avocado
|
| Polyunsaturated fat | 0.06g | N/A | 82% |
799.6 times less than Walnut
|
| Tryptophan | 0.02mg | 0% | 52% |
16.9 times less than Chicken meat
|
| Lysine | 0.14mg | 0% | 48% |
3.3 times less than Tofu
|
| Methionine | 0.01mg | 0% | 54% |
6.9 times less than Quinoa
|
| Caffeine | 0mg | 0% | 100% | |
| Omega-3 - EPA | 0g | N/A | 100% |
N/A
|
| Omega-3 - DHA | 0g | N/A | 100% |
N/A
|
| Omega-3 - DPA | 0g | N/A | 100% |
N/A
|
Check out similar food or compare with current
NUTRITION FACTS LABEL
Serving Size ______________
Health checks
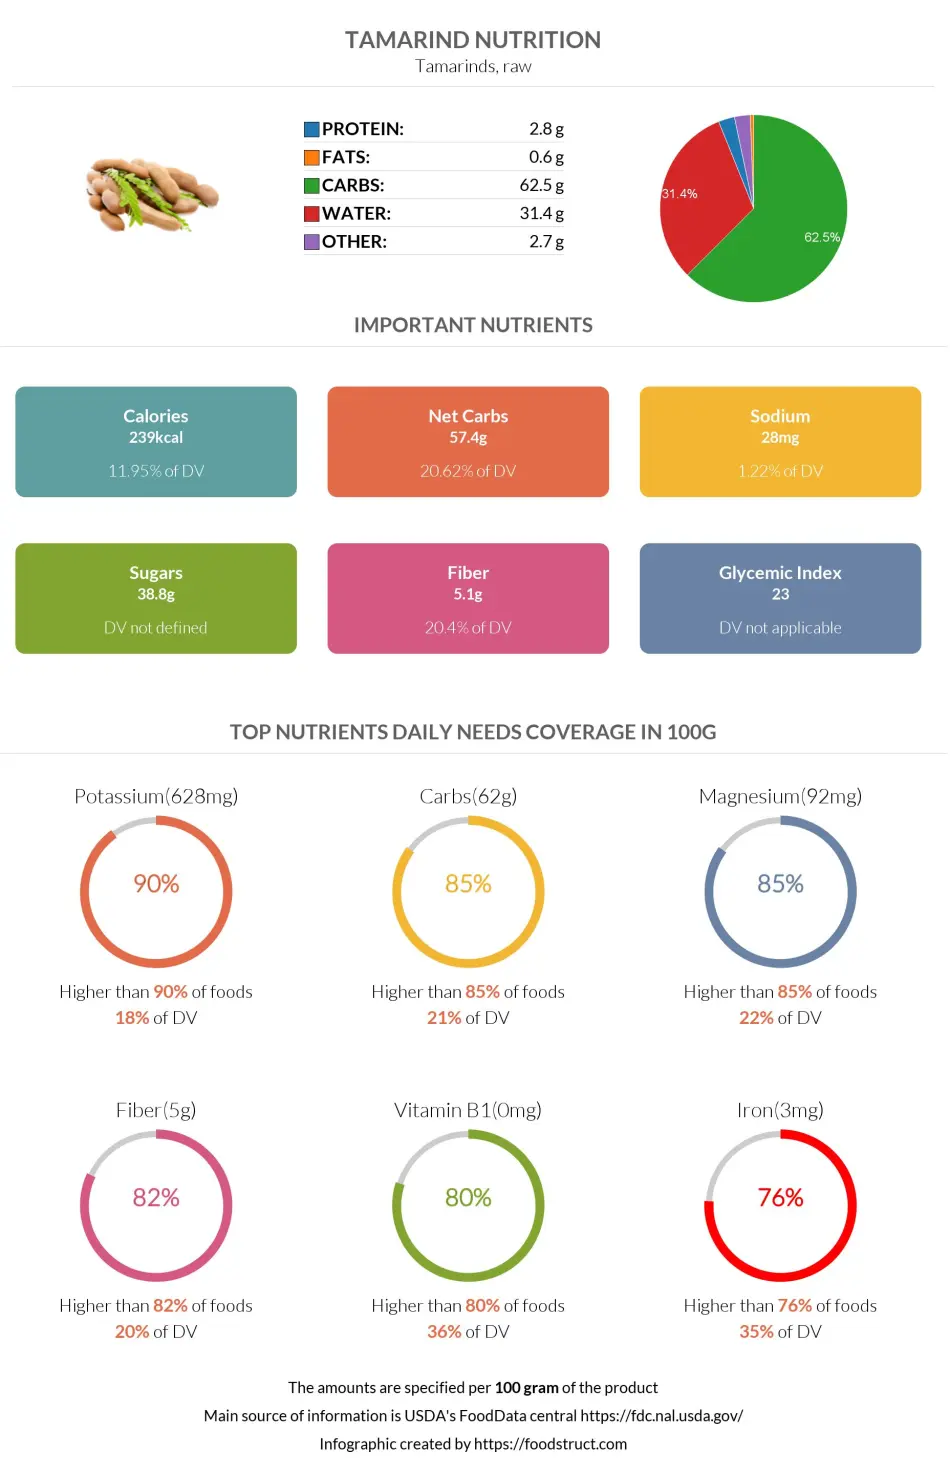
Tamarind nutrition infographic
References
All the values for which the sources are not specified explicitly are taken from FDA’s Food Central. The exact link to the food presented on this page can be found below.