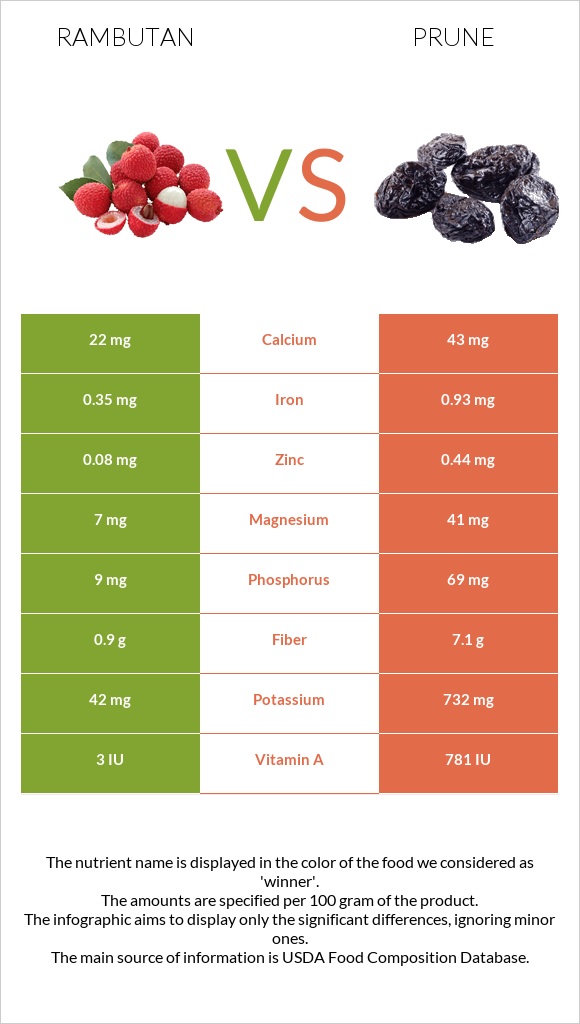
Important differences between rambutan and prunes Prunes have more fiber, copper, potassium, vitamin A, vitamin B6, vitamin B2, phosphorus, magnesium, vitamin B5, and iron than rambutan. Prunes' daily need coverage for fiber is 25% more. Rambutan has a higher glycemic index. The glycemic index of rambutan is 59, while the glycemic index of prunes is 29. The food varieties used in the comparison are Rambutan, canned, syrup pack and Plums, dried (prunes), uncooked .
Infographic
Mineral Comparison
Mineral comparison score is based on the number of minerals by which one or the other food is richer. The "coverage" charts below show how much of the daily needs can be covered by 300 grams of the food.
1
100 g
300 g
1 fruit - 9g 1 cup, drained - 150g 1 cup - 214g
Magnesium
Magnesium
Calcium
Calcium
Potassium
Potassium
Iron
Iron
Copper
Copper
Zinc
Zinc
Phosphorus
Phosphorus
Sodium
Sodium
Manganese
Manganese
Selenium
Selenium
5%
6.6%
3.7%
13%
22%
2.2%
3.9%
1.4%
45%
0%
9
100 g
300 g
1 prune, pitted - 9.5g 1 cup, pitted - 174g
Magnesium
Magnesium
Calcium
Calcium
Potassium
Potassium
Iron
Iron
Copper
Copper
Zinc
Zinc
Phosphorus
Phosphorus
Sodium
Sodium
Manganese
Manganese
Selenium
Selenium
29%
13%
65%
35%
94%
12%
30%
0.26%
39%
1.6%
Vitamin Comparison
Vitamin comparison score is based on the number of vitamins by which one or the other food is richer. The "coverage" charts below show how much of the daily needs can be covered by 300 grams of the food.
2
100 g
300 g
1 fruit - 9g 1 cup, drained - 150g 1 cup - 214g
Vitamin C
Vit. C
Vitamin D
Vit. D
Vitamin A
Vit. A
Vitamin E
Vit. E
Vitamin B1
Vit. B1
Vitamin B2
Vit. B2
Vitamin B3
Vit. B3
Vitamin B5
Vit. B5
Vitamin B6
Vit. B6
Vitamin B12
Vit. B12
Vitamin K
Vit. K
Folate
Folate
16%
0%
0%
0%
3.3%
5.1%
25%
1.1%
4.6%
0%
0%
6%
8
100 g
300 g
1 prune, pitted - 9.5g 1 cup, pitted - 174g
Vitamin C
Vit. C
Vitamin D
Vit. D
Vitamin A
Vit. A
Vitamin E
Vit. E
Vitamin B1
Vit. B1
Vitamin B2
Vit. B2
Vitamin B3
Vit. B3
Vitamin B5
Vit. B5
Vitamin B6
Vit. B6
Vitamin B12
Vit. B12
Vitamin K
Vit. K
Folate
Folate
2%
0%
13%
8.6%
13%
43%
35%
25%
47%
0%
149%
3%
All nutrients comparison - raw data values
Nutrient
DV% diff.
Vitamin K
59.5µg
50%
Fiber
0.9g
7.1g
25%
Copper
0.066mg
0.281mg
24%
Potassium
42mg
732mg
20%
Fructose
12.45g
16%
Carbs
20.87g
63.88g
14%
Vitamin B6
0.02mg
0.205mg
14%
Vitamin B2
0.022mg
0.186mg
13%
Phosphorus
9mg
69mg
9%
Calories
82kcal
240kcal
8%
Magnesium
7mg
41mg
8%
Vitamin B5
0.018mg
0.422mg
8%
Iron
0.35mg
0.93mg
7%
Vitamin C
4.9mg
0.6mg
5%
Vitamin A
0µg
39µg
4%
Protein
0.65g
2.18g
3%
Zinc
0.08mg
0.44mg
3%
Vitamin E
0.43mg
3%
Vitamin B1
0.013mg
0.051mg
3%
Vitamin B3
1.352mg
1.882mg
3%
Calcium
22mg
43mg
2%
Starch
5.11g
2%
Manganese
0.343mg
0.299mg
2%
Choline
10.1mg
2%
Selenium
0.3µg
1%
Folate
8µg
4µg
1%
Weight per 100 calories
122g
42g
N/A
Fats
0.21g
0.38g
0%
Net carbs
19.97g
56.78g
N/A
Sugar
38.13g
N/A
Sodium
11mg
2mg
0%
Saturated fat
0.088g
0%
Monounsaturated fat
0.053g
0%
Polyunsaturated fat
0.062g
0%
Tryptophan
0.025mg
0%
Threonine
0.049mg
0%
Isoleucine
0.041mg
0%
Leucine
0.066mg
0%
Lysine
0.05mg
0%
Methionine
0.016mg
0%
Phenylalanine
0.052mg
0%
Valine
0.056mg
0%
Histidine
0.027mg
0%
Macronutrient Comparison
Macronutrient breakdown side-by-side comparison
1
21%
78%
Protein:
0.65 g
Fats:
0.21 g
Carbs:
20.87 g
Water:
78.04 g
Other:
0.23 g
4
2%
64%
31%
3%
Protein:
2.18 g
Fats:
0.38 g
Carbs:
63.88 g
Water:
30.92 g
Other:
2.64 g
Contains
more
Water Water
+152.4%
Contains
more
Protein Protein
+235.4%
Contains
more
Fats Fats
+81%
Contains
more
Carbs Carbs
+206.1%
Contains
more
Other Other
+1047.8%