Raspberry vs. Blueberry — Health Impact and Nutrition Comparison


Summary
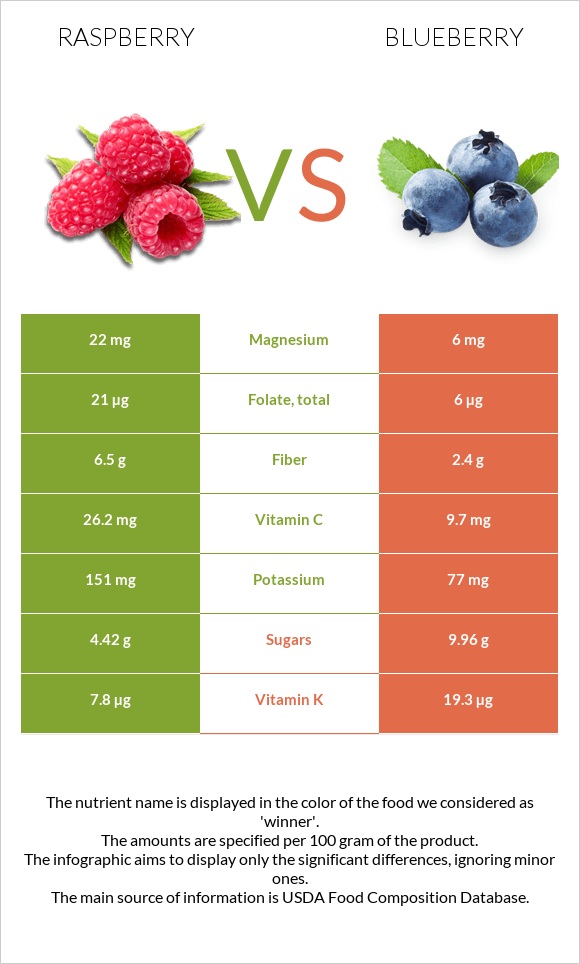
Raspberry is richer in vitamin C, fiber, and iron, while blueberry is higher in vitamin K. Blueberry contains more sugar. Raspberry provides three times more vitamin C than blueberry. Raspberry contains four times more Magnesium than Blueberry. Raspberry contains 22mg of Magnesium, while blueberry contains 6mg.
Introduction
In this article, we will compare two famous berries - raspberry(1) and blueberry (2), showing their differences in nutritional profile and health impact.
Raspberry is a fruit produced by a plant belonging to the Rosaceae family - Rubus idaeus. It is cultivated worldwide. Blueberry is a superfood that grows on the blueberry bush. The most common blueberry plant cultivated in the US is the highbush blueberry.
Taste, smell, appearance
Raspberry is a small conical fruit covered with a velvety red skin, while blueberry is a round berry with many seeds inside. Blueberry is firstly green, and then it turns into deep purple or blue.
Blueberry has a fruity, herbaceous smell, while raspberry often has a sour, sweet, juicy odor. Blueberry has a melon-like, herbal, oily taste, and the raspberry flavor is both tart and sweet.
Nutrition
Although both raspberry and blueberry contain 85% of water, they differ in the distribution of macronutrients they provide. Check the chart shown below to visualize the nutrient composition of these berries.
Macronutrient Comparison
Contains
more
ProteinProtein
+62.2%
Contains
more
FatsFats
+97%
Contains
more
OtherOther
+100%
Contains
more
CarbsCarbs
+21.4%
Carbs
Blueberry is higher in carbs than raspberry: this is why it may seem sweeter. Blueberry provides 14.5g of carbs compared to 12g containing raspberry. The sweetness of blueberry is linked to its higher sugar content.
Fiber
Raspberry is 2.1g richer in fiber than blueberry. Raspberry is a good source of soluble fiber and helps lower total blood cholesterol levels.
Carbohydrate type comparison
Contains
more
SucroseSucrose
+81.8%
Contains
more
StarchStarch
+∞%
Contains
more
GlucoseGlucose
+162.4%
Contains
more
FructoseFructose
+111.5%
Protein
Being plant food products, raspberry and blueberry contain small amounts of protein. However, raspberry is slightly higher in protein.
Fat
Raspberry and blueberry contain less than one gram of fat per 100g; hence we can neglect the fat amounts.
Fat Type Comparison
Contains
less
Sat. FatSaturated fat
-32.1%
Contains
more
Mono. FatMonounsaturated fat
+36.2%
Contains
more
Poly. FatPolyunsaturated fat
+156.8%
Calories
Raspberry and blueberry are classified as low-calorie foods. However, blueberry contains five calories more compared to blueberry.
Minerals
The winner in this section is raspberry. It is higher in all minerals than blueberry. Raspberry contains two times more potassium than blueberry. It is significantly richer in copper and iron.
Mineral Comparison
Contains
more
MagnesiumMagnesium
+266.7%
Contains
more
CalciumCalcium
+316.7%
Contains
more
PotassiumPotassium
+96.1%
Contains
more
IronIron
+146.4%
Contains
more
CopperCopper
+57.9%
Contains
more
ZincZinc
+162.5%
Contains
more
PhosphorusPhosphorus
+141.7%
Contains
more
ManganeseManganese
+99.4%
Contains
more
SeleniumSelenium
+100%
Vitamins
Raspberry contains nearly three times higher in vitamin C than blueberry. It is also richer in vitamins B3, B5, and folate.
Blueberry is 11.5mg higher in vitamin K. It contains more vitamins A and B1.
Vitamin Comparison
Contains
more
Vitamin CVitamin C
+170.1%
Contains
more
Vitamin EVitamin E
+52.6%
Contains
more
Vitamin B3Vitamin B3
+43.1%
Contains
more
Vitamin B5Vitamin B5
+165.3%
Contains
more
FolateFolate
+250%
Contains
more
Vitamin AVitamin A
+50%
Contains
more
Vitamin B1Vitamin B1
+15.6%
Contains
more
Vitamin KVitamin K
+147.4%
Glycemic index
Blueberry and raspberry are classified as low-GI foods. However, blueberry’s GI is twice higher: blueberry’s GI equals 53, while raspberry’s GI is 26.
Check our glycemic index chart page for more information about the GI of other foods.
Health benefits
Antioxidants
Antioxidants are chemicals produced by plants that fight oxidative damage during inflammation. Oxidative stress can lead to serious health problems such as cancer, cardiovascular problems, diabetes, and other diseases (3). Raspberries and blueberries produce different antioxidants to fight oxidative damage.
Raspberries are high in vitamin C, ellagic acid, and quercetin (4). A study indicates that consuming raspberries shows anti-inflammatory and antioxidant effects, thus fighting chronic diseases (5). Ellagic acid may also have DNA-repairing effects (6).
Blueberries are believed to have the highest antioxidant activity among fruits (7) (8). They are particularly rich in anthocyanins - flavonoids responsible for these berries’ antioxidant capacities (9).
Diabetes
Raspberries may improve insulin resistance and lower blood sugar levels. It is high in tannin - an alpha-amylase inhibitor that prevents the breaking down of the starch (10).
Fresh and frozen blueberries have shown beneficial effects on people with type 2 diabetes. They improve glucose metabolism and insulin sensitivity (11) (12) (13).
References
- https://fdc.nal.usda.gov/fdc-app.html#/food-details/167755/nutrients
- https://fdc.nal.usda.gov/fdc-app.html#/food-details/171711/nutrients
- https://pubmed.ncbi.nlm.nih.gov/25942353/
- https://pubmed.ncbi.nlm.nih.gov/26501271/
- https://pubmed.ncbi.nlm.nih.gov/26773014/
- https://pubmed.ncbi.nlm.nih.gov/19325752/
- https://pubmed.ncbi.nlm.nih.gov/18759450/
- https://pubmed.ncbi.nlm.nih.gov/15186133/
- https://pubmed.ncbi.nlm.nih.gov/22175691/
- https://pubmed.ncbi.nlm.nih.gov/15796622/
- https://pubmed.ncbi.nlm.nih.gov/34883305/
- https://pubmed.ncbi.nlm.nih.gov/31139236/
- https://pubmed.ncbi.nlm.nih.gov/33922965/

Infographic
All nutrients comparison - raw data values
| Nutrient | |
|
DV% diff. |
| Vitamin C | 26.2mg | 9.7mg | 18% |
| Fiber | 6.5g | 2.4g | 16% |
| Manganese | 0.67mg | 0.336mg | 15% |
| Vitamin K | 7.8µg | 19.3µg | 10% |
| Iron | 0.69mg | 0.28mg | 5% |
| Magnesium | 22mg | 6mg | 4% |
| Copper | 0.09mg | 0.057mg | 4% |
| Vitamin B5 | 0.329mg | 0.124mg | 4% |
| Folate | 21µg | 6µg | 4% |
| Fructose | 2.35g | 4.97g | 3% |
| Calcium | 25mg | 6mg | 2% |
| Potassium | 151mg | 77mg | 2% |
| Zinc | 0.42mg | 0.16mg | 2% |
| Phosphorus | 29mg | 12mg | 2% |
| Vitamin E | 0.87mg | 0.57mg | 2% |
| Polyunsaturated fat | 0.375g | 0.146g | 2% |
| Protein | 1.2g | 0.74g | 1% |
| Carbs | 11.94g | 14.49g | 1% |
| Vitamin B3 | 0.598mg | 0.418mg | 1% |
| Choline | 12.3mg | 6mg | 1% |
| Calories | 52kcal | 57kcal | 0% |
| Protein per 100 calories | 2.3g | 1.3g | N/A |
| Calories per 10 g protein | 433kcal | 770kcal | N/A |
| Weight per 100 calories | 192g | 175g | N/A |
| Fats | 0.65g | 0.33g | 0% |
| Net carbs | 5.44g | 12.09g | N/A |
| Sugar | 4.42g | 9.96g | N/A |
| Starch | 0g | 0.03g | 0% |
| Sodium | 1mg | 1mg | 0% |
| Vitamin A | 2µg | 3µg | 0% |
| Selenium | 0.2µg | 0.1µg | 0% |
| Vitamin B1 | 0.032mg | 0.037mg | 0% |
| Vitamin B2 | 0.038mg | 0.041mg | 0% |
| Vitamin B6 | 0.055mg | 0.052mg | 0% |
| Saturated fat | 0.019g | 0.028g | 0% |
| Monounsaturated fat | 0.064g | 0.047g | 0% |
| Tryptophan | 0.003mg | 0% | |
| Threonine | 0.02mg | 0% | |
| Isoleucine | 0.023mg | 0% | |
| Leucine | 0.044mg | 0% | |
| Lysine | 0.013mg | 0% | |
| Methionine | 0.012mg | 0% | |
| Phenylalanine | 0.026mg | 0% | |
| Valine | 0.031mg | 0% | |
| Histidine | 0.011mg | 0% |
People also compare


References
All the values for which the sources are not specified explicitly are taken from FDA’s Food Central. The exact link to the food presented on this page can be found below.
- Raspberry - https://fdc.nal.usda.gov/fdc-app.html#/food-details/167755/nutrients
- Blueberry - https://fdc.nal.usda.gov/fdc-app.html#/food-details/171711/nutrients
All the Daily Values are presented for males aged 31-50, for 2000-calorie diets.