Raspberry nutrition: calories, carbs, GI, protein, fiber, fats

Carbs in Raspberry
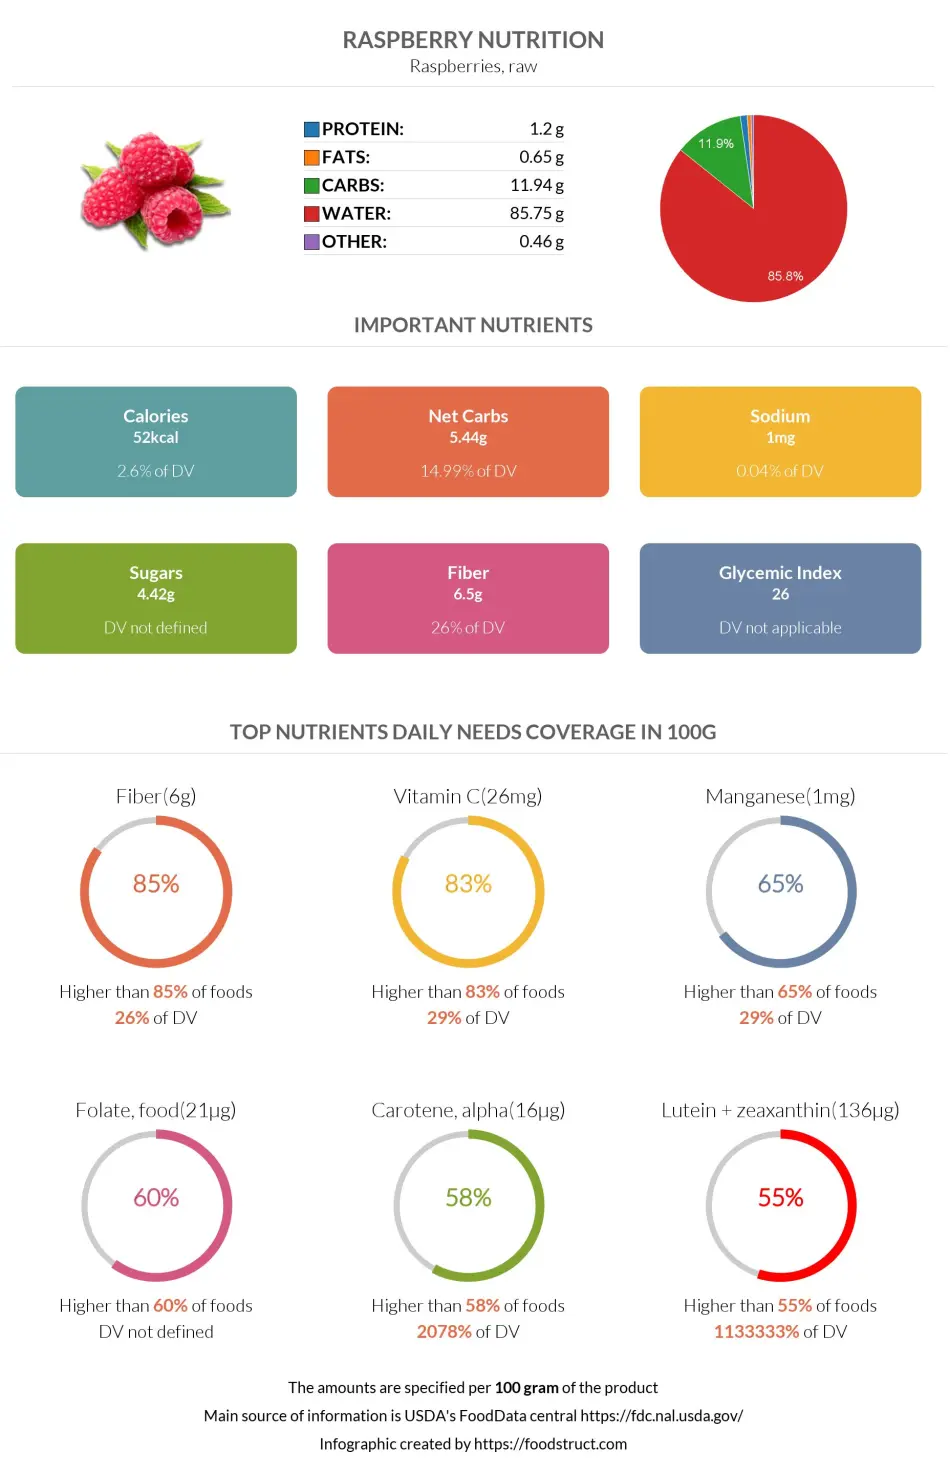
If we ignore 86% of the mass of the raspberry, which is water, we will notice it is primarily composed of carbohydrates. A 100g of raw red raspberries provides 11.9 grams of carbs. This amount equals only 4% of the DV of carbohydrates.
According to our database, raspberry is higher in carbs than 65% of other foods.
Macronutrients chart
Carbs per serving size
Usually, raspberries are served in one cup, equalling 123 grams.
One serving of raspberries contains 14.6g of carbs.
Different Types
Carb content in raspberries can differ when the fruit is processed.
| Carbs per 100g | |
| Seedless raspberry puree | 7.99g |
| Frozen raspberry unsweetened | 12.6g |
| Frozen raspberry sweetened | 26.2g |
Carbohydrate Type Breakdown
The chart below shows that 2.4g of sugars in raspberry is fructose, and 1.9g is glucose. The sucrose levels are low and can be ignored.
Carbohydrate type breakdown
Fiber in raspberry
Raspberry is packed with fiber. In this food, 6.5 grams of overall carbs are fibers.
Most of the fibers in raspberries are soluble.
Fiber content ratio for Raspberry
COMPARISON WITH OTHER FOODS
| Food | Carbs per serving | Carbs per 100g |
| Raspberry | 14.6g (123g) | 11.9g |
| Blueberry | 21.5g (148g) | 14.5g |
| Bananas | 22.1g (110g) | 20.1g |
| Strawberry | 7.6g (100g) | 7.6g |
| Blackberry | 13.8g (144g) | 9.6g |
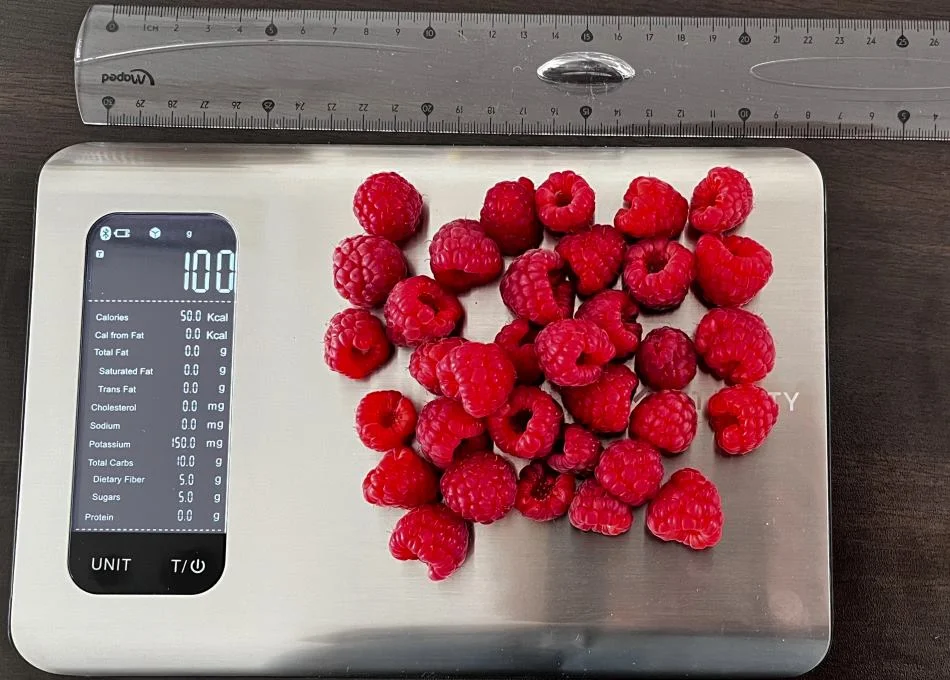
What Do 52 Calories or 100 Grams of Raspberry Look Like?
We measured what 100 grams of raspberries look like to help you visualize their weight and calories. As evident in the picture, approximately 33 raspberries make up 100 grams, equating to 52 calories. This implies that one serving of raspberries (123g) contains 64 calories.
Keep in mind that the actual weight and calorie content may vary depending on the size and ripeness of the raspberries.

Top nutrition facts for Raspberry
| Calories ⓘ Calories for selected serving | 52 kcal |
| Glycemic index ⓘ Gi values are taken from various scientific sources. GI values less than 55 are considered as low. Values above 70 are considered as high. | 26 (low) |
| Glycemic load ⓘ Glycemic Load (GL) is a metric that measures both the quality (Glycemic Index) and quantity of carbohydrates in a specific serving of food to estimate its impact on blood sugar levels. It is calculated as: (GI × Carbs in grams) / 100. | 2 (low) |
| Net carbs ⓘ Net Carbs = Total Carbohydrates – Fiber – Sugar Alcohols | 5 g |
| Default serving size ⓘ Serving sizes are mostly taken from FDA's Reference Amounts Customarily Consumed (RACCs) | 1 cup (123 g) |
| Acidity (Based on PRAL) ⓘ PRAL (Potential renal acid load) is calculated using a formula. On the PRAL scale the higher the positive value, the more is the acidifying effect on the body. The lower the negative value, the higher the alkalinity of the food. 0 is neutral. | -2.4 (alkaline) |
| Oxalates | 18 mg ⓘ https://www.researchgate.net/publication/259133562 |
Raspberry calories (kcal)
| Calories for different serving sizes of raspberry | Calories | Weight |
|---|---|---|
| Calories in 100 grams | 52 | |
| Calories in 10 raspberries | 10 | 19 g |
| Calories in 1 cup | 64 | 123 g |
| Calories in 1 pint as purchased, yields | 162 | 312 g |
Extra Nutrition facts for Raspberry
| Protein per 100 calories ⓘ Shows how many grams of protein you get from 100 calories of this food, calculated as (protein in g ÷ calories) × 100. | 2.3 g |
| Calories per 10 g protein ⓘ Shows how many calories you need to eat from this food to get 10 g of protein, calculated as (calories ÷ protein in g) × 10. | 433 kcal |
| Weight per 100 calories ⓘ Shows how many grams of this food equal 100 kcal—higher grams mean a larger portion for the same calories. | 192 g |
Raspberry Glycemic index (GI)
Raspberry Glycemic load (GL)
Mineral coverage chart
Mineral chart - relative view
Vitamin coverage chart
Vitamin chart - relative view
Fat type information
All nutrients for Raspberry per 100g
| Nutrient | Value | DV% | In TOP % of foods | Comparison |
| Vitamin A | 2µg | 0% | 51% | |
| Calories | 52kcal | 3% | 87% |
1.1 times more than Orange
|
| Protein | 1.2g | 3% | 84% |
2.4 times less than Broccoli
|
| Protein per 100 calories | 2.3g | N/A | 68% | |
| Calories per 10 g protein | 433kcal | N/A | 29% | |
| Weight per 100 calories | 192g | N/A | 14% | |
| Fats | 0.65g | 1% | 79% |
51.2 times less than Cheese
|
| Vitamin C | 26mg | 29% | 8% |
2 times less than Lemon
|
| Carbs | 12g | 4% | 46% |
2.4 times less than Rice
|
| Net carbs | 5.4g | N/A | 56% |
10 times less than Chocolate
|
| Cholesterol | 0mg | 0% | 100% |
N/A
|
| Vitamin D* | 0 IU | 0% | 100% |
N/A
|
| Vitamin D | 0µg | 0% | 100% |
N/A
|
| Magnesium | 22mg | 5% | 46% |
6.4 times less than Almonds
|
| Calcium | 25mg | 3% | 44% |
5 times less than Milk
|
| Potassium | 151mg | 4% | 66% |
Equal to Cucumber
|
| Iron | 0.69mg | 9% | 69% |
3.8 times less than Beef broiled
|
| Sugar | 4.4g | N/A | 29% |
2 times less than Coca-Cola
|
| Fiber | 6.5g | 26% | 9% |
2.7 times more than Orange
|
| Copper | 0.09mg | 10% | 44% |
1.6 times less than Shiitake
|
| Zinc | 0.42mg | 4% | 65% |
15 times less than Beef broiled
|
| Starch | 0g | 0% | 100% |
N/A
|
| Phosphorus | 29mg | 4% | 78% |
6.3 times less than Chicken meat
|
| Sodium | 1mg | 0% | 97% |
490 times less than White bread
|
| Vitamin E | 0.87mg | 6% | 16% |
1.7 times less than Kiwi
|
| Manganese | 0.67mg | 29% | 11% | |
| Selenium | 0.2µg | 0% | 75% | |
| Vitamin B1 | 0.03mg | 3% | 74% |
8.3 times less than Pea raw
|
| Vitamin B2 | 0.04mg | 3% | 78% |
3.4 times less than Avocado
|
| Vitamin B3 | 0.6mg | 4% | 69% |
16 times less than Turkey meat
|
| Vitamin B5 | 0.33mg | 7% | 46% |
3.4 times less than Sunflower seeds
|
| Vitamin B6 | 0.06mg | 4% | 67% |
2.2 times less than Oats
|
| Vitamin B12 | 0µg | 0% | 100% |
N/A
|
| Vitamin K | 7.8µg | 7% | 12% |
13 times less than Broccoli
|
| Trans fat | 0g | N/A | 100% |
N/A
|
| Folate | 21µg | 5% | 33% |
2.9 times less than Brussels sprouts
|
| Saturated fat | 0.02g | 0% | 88% |
310.3 times less than Beef broiled
|
| Choline | 12mg | 2% | 38% | |
| Monounsaturated fat | 0.06g | N/A | 76% |
153.1 times less than Avocado
|
| Polyunsaturated fat | 0.38g | N/A | 61% |
125.8 times less than Walnut
|
| Fructose | 2.4g | 3% | 3% |
2.5 times less than Apple
|
| Caffeine | 0mg | 0% | 100% | |
| Omega-3 - EPA | 0g | N/A | 100% |
N/A
|
| Omega-3 - DHA | 0g | N/A | 100% |
N/A
|
| Omega-3 - DPA | 0g | N/A | 100% |
N/A
|
Check out similar food or compare with current
NUTRITION FACTS LABEL
Serving Size ______________
Health checks
Raspberry nutrition infographic
References
All the values for which the sources are not specified explicitly are taken from FDA’s Food Central. The exact link to the food presented on this page can be found below.