Red Bull vs. Agave nectar — In-Depth Nutrition Comparison
Compare
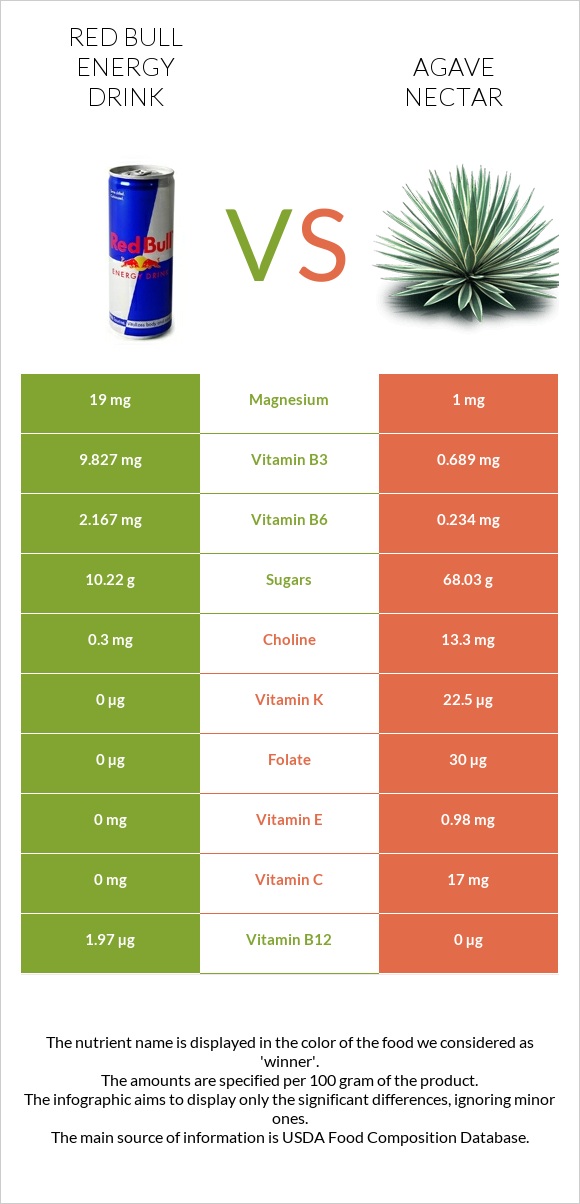
What are the main differences between Red Bull and agave nectar?
- Red Bull is richer in vitamin B6, vitamin B12, and vitamin B3, yet agave nectar is richer in vitamin C, vitamin K, folate, vitamin B1, and vitamin E.
- Red Bull's daily need coverage for vitamin B6 is 149% higher.
We used Beverages, Energy drink, RED BULL and Sweetener, syrup, agave types in this comparison.
Infographic
Infographic link
Mineral Comparison
Mineral comparison score is based on the number of minerals by which one or the other food is richer. The "coverage" charts below show how much of the daily needs can be covered by 300 grams of the food.
| Contains more MagnesiumMagnesium | +1800% |
| Contains more CalciumCalcium | +500% |
| Contains more PotassiumPotassium | +33.3% |
| Contains more IronIron | +50% |
| Contains more CopperCopper | +350% |
| Contains more PhosphorusPhosphorus | +∞% |
| Contains less SodiumSodium | -89.7% |
| Contains more SeleniumSelenium | +750% |
Vitamin Comparison
Vitamin comparison score is based on the number of vitamins by which one or the other food is richer. The "coverage" charts below show how much of the daily needs can be covered by 300 grams of the food.
| Contains more Vitamin B3Vitamin B3 | +1326.3% |
| Contains more Vitamin B5Vitamin B5 | +∞% |
| Contains more Vitamin B6Vitamin B6 | +826.1% |
| Contains more Vitamin B12Vitamin B12 | +∞% |
| Contains more Vitamin CVitamin C | +∞% |
| Contains more Vitamin AVitamin A | +∞% |
| Contains more Vitamin EVitamin E | +∞% |
| Contains more Vitamin B1Vitamin B1 | +205% |
| Contains more Vitamin B2Vitamin B2 | +60.2% |
| Contains more Vitamin KVitamin K | +∞% |
| Contains more FolateFolate | +∞% |
All nutrients comparison - raw data values
| Nutrient |  |
 |
DV% diff. |
| Vitamin B6 | 2.167mg | 0.234mg | 149% |
| Vitamin B12 | 1.97µg | 0µg | 82% |
| Fructose | 1.63g | 55.6g | 67% |
| Vitamin B3 | 9.827mg | 0.689mg | 57% |
| Vitamin B5 | 1.54mg | 31% | |
| Carbs | 10.23g | 76.37g | 22% |
| Vitamin C | 0mg | 17mg | 19% |
| Vitamin K | 0µg | 22.5µg | 19% |
| Calories | 43kcal | 310kcal | 13% |
| Folate | 0µg | 30µg | 8% |
| Vitamin E | 0mg | 0.98mg | 7% |
| Vitamin B1 | 0.04mg | 0.122mg | 7% |
| Caffeine | 29mg | 0mg | 7% |
| Vitamin B2 | 0.103mg | 0.165mg | 5% |
| Magnesium | 19mg | 1mg | 4% |
| Selenium | 0.2µg | 1.7µg | 3% |
| Sodium | 39mg | 4mg | 2% |
| Choline | 0.3mg | 13.3mg | 2% |
| Protein | 0.46g | 0.09g | 1% |
| Fats | 0g | 0.45g | 1% |
| Calcium | 6mg | 1mg | 1% |
| Fiber | 0g | 0.2g | 1% |
| Copper | 0.002mg | 0.009mg | 1% |
| Vitamin A | 0µg | 8µg | 1% |
| Protein per 100 calories | 1.1g | 0.03g | N/A |
| Calories per 10 g protein | 935kcal | 34444kcal | N/A |
| Weight per 100 calories | 233g | 32g | N/A |
| Net carbs | 10.23g | 76.17g | N/A |
| Potassium | 3mg | 4mg | 0% |
| Iron | 0.06mg | 0.09mg | 0% |
| Sugar | 10.22g | 68.03g | N/A |
| Zinc | 0.01mg | 0.01mg | 0% |
| Phosphorus | 0mg | 1mg | 0% |
| Manganese | 0.005mg | 0.005mg | 0% |
Macronutrient Comparison
Macronutrient breakdown side-by-side comparison
Protein:
0.46 g
Fats:
0 g
Carbs:
10.23 g
Water:
89.22 g
Other:
0.09 g
Protein:
0.09 g
Fats:
0.45 g
Carbs:
76.37 g
Water:
22.94 g
Other:
0.15 g
| Contains more ProteinProtein | +411.1% |
| Contains more WaterWater | +288.9% |
| Contains more FatsFats | +∞% |
| Contains more CarbsCarbs | +646.5% |
| Contains more OtherOther | +66.7% |
Carbohydrate type comparison
Carbohydrate type breakdown side-by-side comparison
Starch:
0 g
Sucrose:
5.19 g
Glucose:
3.4 g
Fructose:
1.63 g
Lactose:
0 g
Maltose:
0 g
Galactose:
0 g
Starch:
0 g
Sucrose:
0 g
Glucose:
12.43 g
Fructose:
55.6 g
Lactose:
0 g
Maltose:
0 g
Galactose:
0 g
| Contains more SucroseSucrose | +∞% |
| Contains more GlucoseGlucose | +265.6% |
| Contains more FructoseFructose | +3311% |
~equal in
Starch
~0g
~equal in
Lactose
~0g
~equal in
Maltose
~0g
~equal in
Galactose
~0g


