Agave nectar nutrition: calories, carbs, GI, protein, fiber, fats

Carbohydrates in Agave Nectar
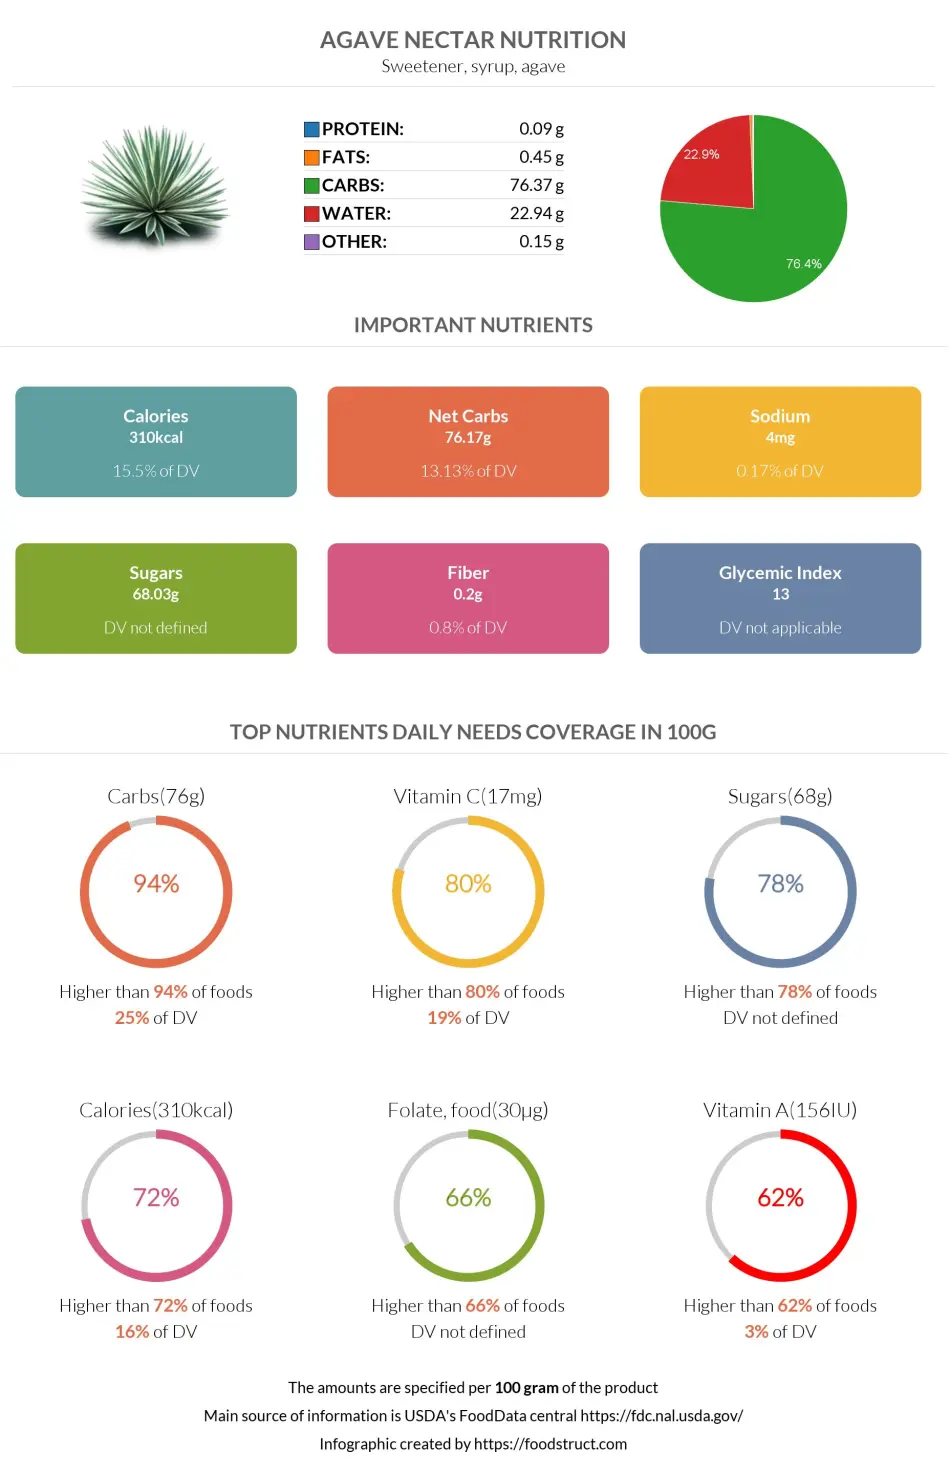
Agave nectar, or maguey syrup or agave syrup, is a natural sweetener from agave succulents. Naturally, agave nectar is very high in carbohydrates, consisting of 76% carbs, 23% water, and less than 1% other nutrients.
Carbohydrates per 100g
A 100g serving of agave nectar, equalling nearly 5tbsp, contains 76.37g carbohydrates.
This puts agave nectar in the top 6% of foods as a source of carbohydrates.
A hundred grams of agave nectar provide 25% of the daily needed value of carbohydrates.
Macronutrients chart
Carbohydrates per Serving Size
One average serving size of agave nectar per person is a quarter cup weighing 55g.
One serving size of agave nectar provides 42g of carbohydrates.
Carbohydrate Breakdown
The carbohydrate content of agave nectar consists of 99.7% net carbs and only 0.3% dietary fiber.
Fiber content ratio for Agave nectar
Sugar Breakdown
Agave nectar’s sugar content comprises two sugars - fructose and glucose. Fructose comprises 82% of sugars, while glucose makes up the other 18%.
Carbohydrate type breakdown
Comparison to Other Sweeteners
If interested, read the complete nutrition and health impact comparison of “Agave Nectar vs. Honey.”
Looking at the table below, you can see how agave nectar compares to other sweeteners regarding carbohydrate content.
| Food | Carbohydrates per serving | Carbohydrates per 100g |
| Agave Nectar | 42g (¼ cup or 55g) | 76g |
| Corn Syrup | 65g (¼ cup or 83g) | 78g |
| Maple Syrup | 56g (¼ cup or 83g) | 67g |
| Honey | 17g (1tbs or 21g) | 82g |
| Brown Sugar | 4g (1tsp or 4.2g) | 98g |
| Sugar | 4g (1tsp or 4.2g) | 100g |

Top nutrition facts for Agave nectar
| Calories ⓘ Calories for selected serving | 310 kcal |
|
Glycemic index ⓘ
Source:
Check out our Glycemic index chart page for the full list.
|
13 (low) |
| Glycemic load ⓘ Glycemic Load (GL) is a metric that measures both the quality (Glycemic Index) and quantity of carbohydrates in a specific serving of food to estimate its impact on blood sugar levels. It is calculated as: (GI × Carbs in grams) / 100. | 5 (low) |
| Net carbs ⓘ Net Carbs = Total Carbohydrates – Fiber – Sugar Alcohols | 76 g |
| Default serving size ⓘ Serving sizes are mostly taken from FDA's Reference Amounts Customarily Consumed (RACCs) | 0.25 cup (55 g) |
| Acidity (Based on PRAL) ⓘ PRAL (Potential renal acid load) is calculated using a formula. On the PRAL scale the higher the positive value, the more is the acidifying effect on the body. The lower the negative value, the higher the alkalinity of the food. 0 is neutral. | -0 (neutral) |
Agave nectar calories (kcal)
| Calories for different serving sizes of agave nectar | Calories | Weight |
|---|---|---|
| Calories in 100 grams | 310 | |
| Calories in 1 tsp | 21 | 6.9 g |
| Calories in 0.25 cup | 171 | 55 g |
| Calories for different varieties of agave nectar | Calories | Weight |
|---|---|---|
| Sweetener, syrup, agave (this food) | 310 | 100 g |
| Agave, raw (Southwest) | 68 | 100 g |
| Agave, cooked (Southwest) | 135 | 100 g |
| Agave, dried (Southwest) | 341 | 100 g |
Extra Nutrition facts for Agave nectar
| Weight per 100 calories ⓘ Shows how many grams of this food equal 100 kcal—higher grams mean a larger portion for the same calories. | 32 g |
Agave nectar Glycemic index (GI)
Agave nectar Glycemic load (GL)
Mineral coverage chart
Mineral chart - relative view
Vitamin coverage chart
Vitamin chart - relative view
All nutrients for Agave nectar per 100g
| Nutrient | Value | DV% | In TOP % of foods | Comparison |
| Vitamin A | 8µg | 1% | 36% | |
| Calories | 310kcal | 16% | 29% |
6.6 times more than Orange
|
| Protein | 0.09g | 0% | 95% |
31.3 times less than Broccoli
|
| Weight per 100 calories | 32g | N/A | 72% | |
| Fats | 0.45g | 1% | 82% |
74 times less than Cheese
|
| Vitamin C | 17mg | 19% | 12% |
3.1 times less than Lemon
|
| Net carbs | 76g | N/A | 4% |
1.4 times more than Chocolate
|
| Carbs | 76g | 25% | 7% |
2.7 times more than Rice
|
| Cholesterol | 0mg | 0% | 100% |
N/A
|
| Vitamin D* | 0 IU | 0% | 100% |
N/A
|
| Vitamin D | 0µg | 0% | 100% |
N/A
|
| Magnesium | 1mg | 0% | 89% |
140 times less than Almonds
|
| Calcium | 1mg | 0% | 93% |
125 times less than Milk
|
| Potassium | 4mg | 0% | 93% |
36.8 times less than Cucumber
|
| Iron | 0.09mg | 1% | 92% |
28.9 times less than Beef broiled
|
| Sugar | 68g | N/A | 1% |
7.6 times more than Coca-Cola
|
| Fiber | 0.2g | 1% | 53% |
12 times less than Orange
|
| Copper | 0.01mg | 1% | 82% |
15.8 times less than Shiitake
|
| Zinc | 0.01mg | 0% | 90% |
631 times less than Beef broiled
|
| Phosphorus | 1mg | 0% | 91% |
182 times less than Chicken meat
|
| Sodium | 4mg | 0% | 92% |
122.5 times less than White bread
|
| Vitamin E | 0.98mg | 7% | 14% |
1.5 times less than Kiwi
|
| Manganese | 0.01mg | 0% | 72% | |
| Selenium | 1.7µg | 3% | 59% | |
| Vitamin B1 | 0.12mg | 10% | 36% |
2.2 times less than Pea raw
|
| Vitamin B2 | 0.17mg | 13% | 48% |
1.3 times more than Avocado
|
| Vitamin B3 | 0.69mg | 4% | 67% |
13.9 times less than Turkey meat
|
| Vitamin B6 | 0.23mg | 18% | 36% |
2 times more than Oats
|
| Vitamin B12 | 0µg | 0% | 100% |
N/A
|
| Vitamin K | 23µg | 19% | 7% |
4.5 times less than Broccoli
|
| Folate | 30µg | 8% | 28% |
2 times less than Brussels sprouts
|
| Choline | 13mg | 2% | 37% | |
| Saturated fat | 0g | 0% | 100% |
N/A
|
| Monounsaturated fat | 0g | N/A | 100% |
N/A
|
| Polyunsaturated fat | 0g | N/A | 100% |
N/A
|
| Fructose | 56g | 70% | 1% |
9.4 times more than Apple
|
| Caffeine | 0mg | 0% | 100% | |
| Omega-3 - EPA | 0g | N/A | 100% |
N/A
|
| Omega-3 - DHA | 0g | N/A | 100% |
N/A
|
| Omega-3 - DPA | 0g | N/A | 100% |
N/A
|
Check out similar food or compare with current
NUTRITION FACTS LABEL
Serving Size ______________
Health checks
Agave nectar nutrition infographic
References
All the values for which the sources are not specified explicitly are taken from FDA’s Food Central. The exact link to the food presented on this page can be found below.