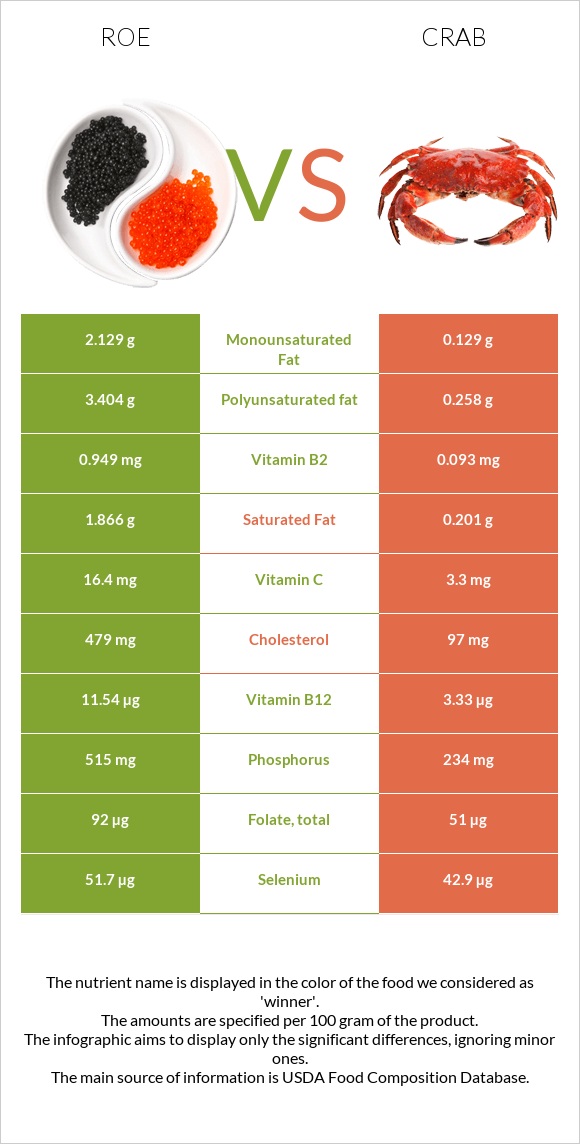
How are roe and crab different? Roe is richer in vitamin B12, vitamin B2, phosphorus, vitamin B1, selenium, and vitamin C, while crab is higher in copper and zinc. Roe covers your daily need for vitamin B12, 342% more than crab. Roe contains 12 times more vitamin B1 than crab. Roe contains 0.277mg of vitamin B1, while crab contains 0.023mg. Crab is lower in cholesterol. Roe has a higher glycemic index (27) than crab (0). Fish, roe, mixed species, cooked, dry heat and Crustaceans, crab, blue, canned types were used in this article.
Infographic
Mineral Comparison
Mineral comparison score is based on the number of minerals by which one or the other food is richer. The "coverage" charts below show how much of the daily needs can be covered by 300 grams of the food.
4
100 g
300 g
1 oz - 28.35g 3 oz - 85g
Magnesium
Magnesium
Calcium
Calcium
Potassium
Potassium
Iron
Iron
Copper
Copper
Zinc
Zinc
Phosphorus
Phosphorus
Sodium
Sodium
Manganese
Manganese
Selenium
Selenium
19%
8.4%
25%
29%
43%
35%
221%
15%
1.7%
282%
5
100 g
300 g
1 oz - 28.35g 3 oz - 85g 1 can (6.5 oz), drained - 125g 1 cup - 135g
Magnesium
Magnesium
Calcium
Calcium
Potassium
Potassium
Iron
Iron
Copper
Copper
Zinc
Zinc
Phosphorus
Phosphorus
Sodium
Sodium
Manganese
Manganese
Selenium
Selenium
26%
27%
23%
19%
271%
104%
100%
73%
9.7%
234%
Vitamin Comparison
Vitamin comparison score is based on the number of vitamins by which one or the other food is richer. The "coverage" charts below show how much of the daily needs can be covered by 300 grams of the food.
8
100 g
300 g
1 oz - 28.35g 3 oz - 85g
Vitamin C
Vit. C
Vitamin D
Vit. D
Vitamin A
Vit. A
Vitamin E
Vit. E
Vitamin B1
Vit. B1
Vitamin B2
Vit. B2
Vitamin B3
Vit. B3
Vitamin B5
Vit. B5
Vitamin B6
Vit. B6
Vitamin B12
Vit. B12
Vitamin K
Vit. K
Folate
Folate
55%
0%
30%
0%
69%
219%
41%
69%
43%
1443%
0%
69%
3
100 g
300 g
1 oz - 28.35g 3 oz - 85g 1 can (6.5 oz), drained - 125g 1 cup - 135g
Vitamin C
Vit. C
Vitamin D
Vit. D
Vitamin A
Vit. A
Vitamin E
Vit. E
Vitamin B1
Vit. B1
Vitamin B2
Vit. B2
Vitamin B3
Vit. B3
Vitamin B5
Vit. B5
Vitamin B6
Vit. B6
Vitamin B12
Vit. B12
Vitamin K
Vit. K
Folate
Folate
11%
0%
0.33%
37%
5.8%
21%
52%
60%
36%
416%
0.75%
38%
All nutrients comparison - raw data values
Nutrient
DV% diff.
Vitamin B12
11.54µg
3.33µg
342%
Cholesterol
479mg
97mg
127%
Copper
0.128mg
0.814mg
76%
Vitamin B2
0.949mg
0.093mg
66%
Phosphorus
515mg
234mg
40%
Zinc
1.28mg
3.81mg
23%
Protein
28.62g
17.88g
21%
Vitamin B1
0.277mg
0.023mg
21%
Polyunsaturated fat
3.404g
0.258g
21%
Sodium
117mg
563mg
19%
Selenium
51.7µg
42.9µg
16%
Vitamin C
16.4mg
3.3mg
15%
Choline
80.9mg
15%
Fats
8.23g
0.74g
12%
Vitamin E
1.84mg
12%
Vitamin A
91µg
1µg
10%
Folate
92µg
51µg
10%
Saturated fat
1.866g
0.201g
8%
Calories
204kcal
83kcal
6%
Calcium
28mg
91mg
6%
Monounsaturated fat
2.129g
0.129g
5%
Iron
0.77mg
0.5mg
3%
Manganese
0.013mg
0.074mg
3%
Vitamin B3
2.192mg
2.747mg
3%
Vitamin B5
1.154mg
0.997mg
3%
Magnesium
26mg
36mg
2%
Vitamin B6
0.185mg
0.156mg
2%
Carbs
1.92g
0g
1%
Potassium
283mg
259mg
1%
Protein per 100 calories
14g
22g
N/A
Calories per 10 g protein
71kcal
46kcal
N/A
Weight per 100 calories
49g
120g
N/A
Unsaturated / Saturated Fat ratio
3
1.9
N/A
Net carbs
1.92g
0g
N/A
Vitamin K
0.3µg
0%
Trans fat
0.014g
N/A
Tryptophan
0.375mg
0.226mg
0%
Threonine
1.305mg
0.727mg
0%
Isoleucine
1.465mg
0.776mg
0%
Leucine
2.509mg
1.307mg
0%
Lysine
2.179mg
1.386mg
0%
Methionine
0.71mg
0.452mg
0%
Phenylalanine
1.401mg
0.708mg
0%
Valine
1.676mg
0.806mg
0%
Histidine
0.778mg
0.393mg
0%
Omega-3 - EPA
1.26g
0.101g
N/A
Omega-3 - DHA
1.747g
0.067g
N/A
Omega-3 - DPA
0.105g
0.009g
N/A
Omega-6 - Eicosadienoic acid
0.005g
N/A
Macronutrient Comparison
Macronutrient breakdown side-by-side comparison
4
29%
8%
2%
59%
3%
Protein:
28.62 g
Fats:
8.23 g
Carbs:
1.92 g
Water:
58.63 g
Other:
2.6 g
1
18%
80%
2%
Protein:
17.88 g
Fats:
0.74 g
Carbs:
0 g
Water:
79.69 g
Other:
1.69 g
Contains
more
Protein Protein
+60.1%
Contains
more
Fats Fats
+1012.2%
Contains
more
Carbs Carbs
+∞%
Contains
more
Other Other
+53.8%
Contains
more
Water Water
+35.9%
Fat Type Comparison
Fat type breakdown side-by-side comparison
2
25%
29%
46%
Saturated fat:
Sat. Fat
1.866 g
Monounsaturated fat:
Mono. Fat
2.129 g
Polyunsaturated fat:
Poly. Fat
3.404 g
1
34%
22%
44%
Saturated fat:
Sat. Fat
0.201 g
Monounsaturated fat:
Mono. Fat
0.129 g
Polyunsaturated fat:
Poly. Fat
0.258 g
Contains
more
Mono. Fat Monounsaturated fat
+1550.4%
Contains
more
Poly. Fat Polyunsaturated fat
+1219.4%
Contains
less
Sat. Fat Saturated fat
-89.2%