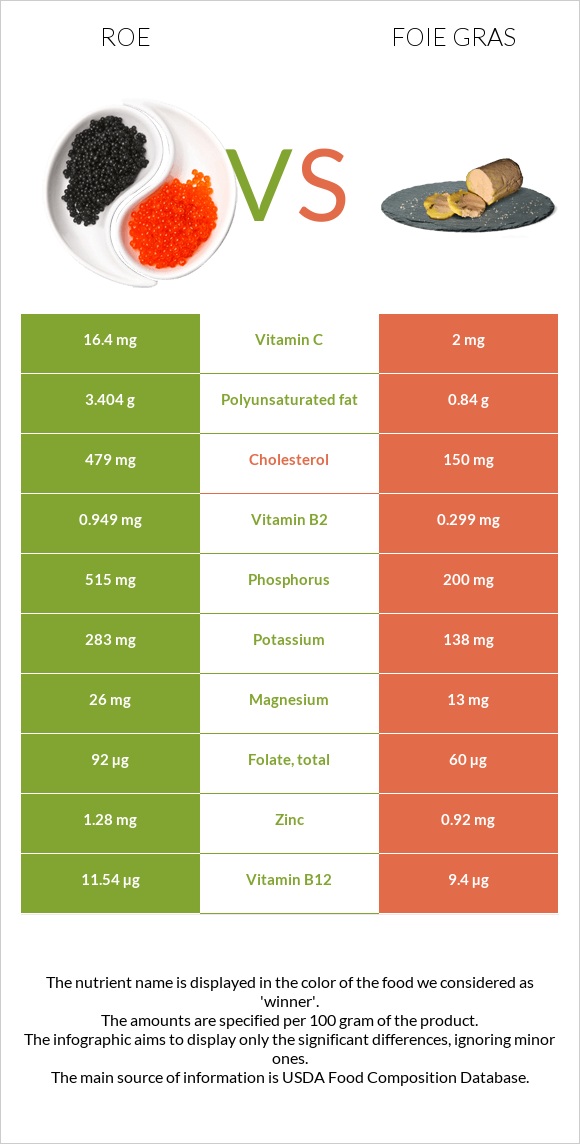
How are roe and foie gras different? Roe is higher in vitamin B12, vitamin B2, phosphorus, and vitamin C; however, foie gras is richer in vitamin A, iron, and copper. Daily need coverage for cholesterol for roe is 110% higher. Roe contains 8 times more vitamin C than foie gras. While roe contains 16.4mg of vitamin C, foie gras contains only 2mg. Foie gras has less cholesterol. Fish, roe, mixed species, cooked, dry heat and Pate de foie gras, canned (goose liver pate), smoked are the varieties used in this article.
Infographic
Mineral Comparison
Mineral comparison score is based on the number of minerals by which one or the other food is richer. The "coverage" charts below show how much of the daily needs can be covered by 300 grams of the food.
6
100 g
300 g
1 oz - 28.35g 3 oz - 85g
Magnesium
Magnesium
Calcium
Calcium
Potassium
Potassium
Iron
Iron
Copper
Copper
Zinc
Zinc
Phosphorus
Phosphorus
Sodium
Sodium
Manganese
Manganese
Selenium
Selenium
19%
8.4%
25%
29%
43%
35%
221%
15%
1.7%
282%
4
100 g
300 g
1 tbsp - 13g 1 oz - 28.35g
Magnesium
Magnesium
Calcium
Calcium
Potassium
Potassium
Iron
Iron
Copper
Copper
Zinc
Zinc
Phosphorus
Phosphorus
Sodium
Sodium
Manganese
Manganese
Selenium
Selenium
9.3%
21%
12%
206%
133%
25%
86%
91%
16%
240%
Vitamin Comparison
Vitamin comparison score is based on the number of vitamins by which one or the other food is richer. The "coverage" charts below show how much of the daily needs can be covered by 300 grams of the food.
6
100 g
300 g
1 oz - 28.35g 3 oz - 85g
Vitamin C
Vit. C
Vitamin D
Vit. D
Vitamin A
Vit. A
Vitamin E
Vit. E
Vitamin B1
Vit. B1
Vitamin B2
Vit. B2
Vitamin B3
Vit. B3
Vitamin B5
Vit. B5
Vitamin B6
Vit. B6
Vitamin B12
Vit. B12
Vitamin K
Vit. K
Folate
Folate
55%
0%
30%
0%
69%
219%
41%
69%
43%
1443%
0%
69%
2
100 g
300 g
1 tbsp - 13g 1 oz - 28.35g
Vitamin C
Vit. C
Vitamin D
Vit. D
Vitamin A
Vit. A
Vitamin E
Vit. E
Vitamin B1
Vit. B1
Vitamin B2
Vit. B2
Vitamin B3
Vit. B3
Vitamin B5
Vit. B5
Vitamin B6
Vit. B6
Vitamin B12
Vit. B12
Vitamin K
Vit. K
Folate
Folate
6.7%
0%
334%
0%
22%
69%
47%
72%
14%
1175%
0%
45%
All nutrients comparison - raw data values
Nutrient
DV% diff.
Cholesterol
479mg
150mg
110%
Vitamin A
91µg
1001µg
101%
Vitamin B12
11.54µg
9.4µg
89%
Iron
0.77mg
5.5mg
59%
Monounsaturated fat
2.129g
25.61g
59%
Saturated fat
1.866g
14.45g
57%
Fats
8.23g
43.84g
55%
Vitamin B2
0.949mg
0.299mg
50%
Phosphorus
515mg
200mg
45%
Protein
28.62g
11.4g
34%
Copper
0.128mg
0.4mg
30%
Sodium
117mg
697mg
25%
Polyunsaturated fat
3.404g
0.84g
17%
Vitamin C
16.4mg
2mg
16%
Vitamin B1
0.277mg
0.088mg
16%
Selenium
51.7µg
44µg
14%
Calories
204kcal
462kcal
13%
Vitamin B6
0.185mg
0.06mg
10%
Folate
92µg
60µg
8%
Manganese
0.013mg
0.12mg
5%
Calcium
28mg
70mg
4%
Potassium
283mg
138mg
4%
Magnesium
26mg
13mg
3%
Zinc
1.28mg
0.92mg
3%
Vitamin B3
2.192mg
2.51mg
2%
Carbs
1.92g
4.67g
1%
Vitamin B5
1.154mg
1.2mg
1%
Protein per 100 calories
14g
2.5g
N/A
Calories per 10 g protein
71kcal
405kcal
N/A
Weight per 100 calories
49g
22g
N/A
Unsaturated / Saturated Fat ratio
3
1.8
N/A
Net carbs
1.92g
4.67g
N/A
Tryptophan
0.375mg
0.161mg
0%
Threonine
1.305mg
0.507mg
0%
Isoleucine
1.465mg
0.606mg
0%
Leucine
2.509mg
1.029mg
0%
Lysine
2.179mg
0.863mg
0%
Methionine
0.71mg
0.27mg
0%
Phenylalanine
1.401mg
0.567mg
0%
Valine
1.676mg
0.719mg
0%
Histidine
0.778mg
0.303mg
0%
Omega-3 - EPA
1.26g
0g
N/A
Omega-3 - DHA
1.747g
0g
N/A
Omega-3 - DPA
0.105g
0g
N/A
Macronutrient Comparison
Macronutrient breakdown side-by-side comparison
2
29%
8%
2%
59%
3%
Protein:
28.62 g
Fats:
8.23 g
Carbs:
1.92 g
Water:
58.63 g
Other:
2.6 g
3
11%
44%
5%
37%
3%
Protein:
11.4 g
Fats:
43.84 g
Carbs:
4.67 g
Water:
37.04 g
Other:
3.05 g
Contains
more
Protein Protein
+151.1%
Contains
more
Water Water
+58.3%
Contains
more
Fats Fats
+432.7%
Contains
more
Carbs Carbs
+143.2%
Contains
more
Other Other
+17.3%
Fat Type Comparison
Fat type breakdown side-by-side comparison
2
25%
29%
46%
Saturated fat:
Sat. Fat
1.866 g
Monounsaturated fat:
Mono. Fat
2.129 g
Polyunsaturated fat:
Poly. Fat
3.404 g
1
35%
63%
2%
Saturated fat:
Sat. Fat
14.45 g
Monounsaturated fat:
Mono. Fat
25.61 g
Polyunsaturated fat:
Poly. Fat
0.84 g
Contains
less
Sat. Fat Saturated fat
-87.1%
Contains
more
Poly. Fat Polyunsaturated fat
+305.2%
Contains
more
Mono. Fat Monounsaturated fat
+1102.9%