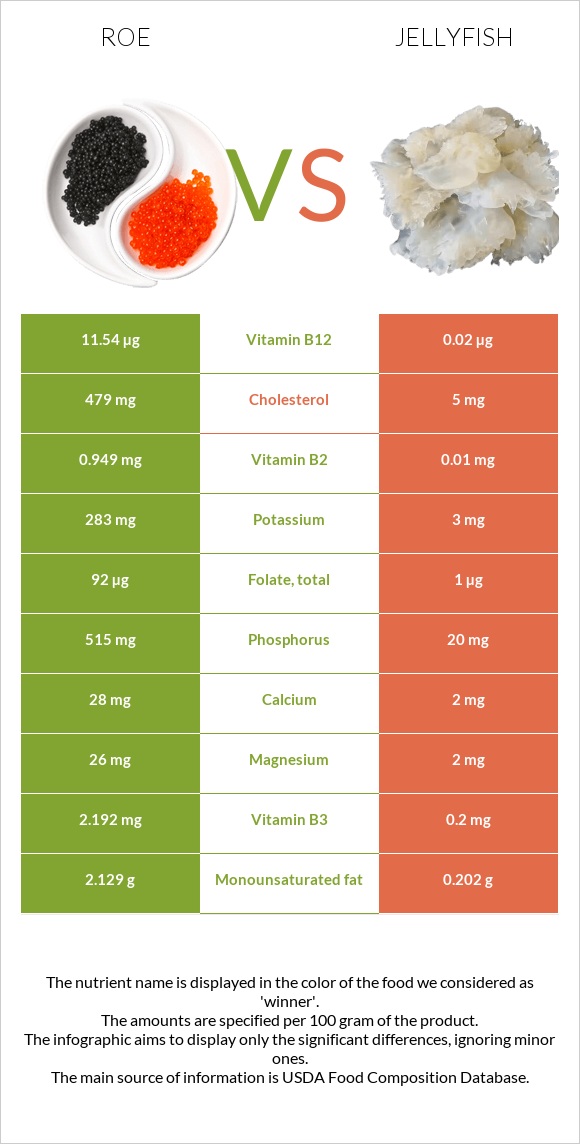
The main differences between roe and jellyfish Roe is richer in vitamin B12, vitamin B2, phosphorus, folate, vitamin B1, vitamin C, and selenium, yet jellyfish is richer in iron. Daily need coverage for vitamin B12 for roe is 480% higher. Jellyfish contains less cholesterol. Food types used in this article are Fish, roe, mixed species, cooked, dry heat and Jellyfish, dried, salted .
Infographic
Mineral Comparison
Mineral comparison score is based on the number of minerals by which one or the other food is richer. The "coverage" charts below show how much of the daily needs can be covered by 300 grams of the food.
8
100 g
300 g
1 oz - 28.35g 3 oz - 85g
Magnesium
Magnesium
Calcium
Calcium
Potassium
Potassium
Iron
Iron
Copper
Copper
Zinc
Zinc
Phosphorus
Phosphorus
Sodium
Sodium
Manganese
Manganese
Selenium
Selenium
19%
8.4%
25%
29%
43%
35%
221%
15%
1.7%
282%
1
100 g
300 g
1 cup - 58g
Magnesium
Magnesium
Calcium
Calcium
Potassium
Potassium
Iron
Iron
Copper
Copper
Zinc
Zinc
Phosphorus
Phosphorus
Sodium
Sodium
Manganese
Manganese
Selenium
Selenium
1.4%
0.6%
0.26%
85%
47%
11%
8.6%
1264%
0%
230%
Vitamin Comparison
Vitamin comparison score is based on the number of vitamins by which one or the other food is richer. The "coverage" charts below show how much of the daily needs can be covered by 300 grams of the food.
9
100 g
300 g
1 oz - 28.35g 3 oz - 85g
Vitamin C
Vit. C
Vitamin D
Vit. D
Vitamin A
Vit. A
Vitamin E
Vit. E
Vitamin B1
Vit. B1
Vitamin B2
Vit. B2
Vitamin B3
Vit. B3
Vitamin B5
Vit. B5
Vitamin B6
Vit. B6
Vitamin B12
Vit. B12
Vitamin K
Vit. K
Folate
Folate
55%
0%
30%
0%
69%
219%
41%
69%
43%
1443%
0%
69%
2
100 g
300 g
1 cup - 58g
Vitamin C
Vit. C
Vitamin D
Vit. D
Vitamin A
Vit. A
Vitamin E
Vit. E
Vitamin B1
Vit. B1
Vitamin B2
Vit. B2
Vitamin B3
Vit. B3
Vitamin B5
Vit. B5
Vitamin B6
Vit. B6
Vitamin B12
Vit. B12
Vitamin K
Vit. K
Folate
Folate
0%
0%
0.67%
0.4%
2.5%
2.3%
3.8%
0%
2.3%
2.5%
0.25%
0.75%
All nutrients comparison - raw data values
Nutrient
DV% diff.
Vitamin B12
11.54µg
0.02µg
480%
Sodium
117mg
9690mg
416%
Cholesterol
479mg
5mg
158%
Vitamin B2
0.949mg
0.01mg
72%
Phosphorus
515mg
20mg
71%
Protein
28.62g
5.5g
46%
Vitamin B5
1.154mg
23%
Folate
92µg
1µg
23%
Vitamin B1
0.277mg
0.01mg
22%
Polyunsaturated fat
3.404g
0.475g
20%
Iron
0.77mg
2.27mg
19%
Vitamin C
16.4mg
0mg
18%
Selenium
51.7µg
42.2µg
17%
Choline
95mg
17%
Vitamin B6
0.185mg
0.01mg
13%
Vitamin B3
2.192mg
0.2mg
12%
Fats
8.23g
1.4g
11%
Vitamin A
91µg
2µg
10%
Calories
204kcal
36kcal
8%
Potassium
283mg
3mg
8%
Zinc
1.28mg
0.42mg
8%
Saturated fat
1.866g
0.273g
7%
Magnesium
26mg
2mg
6%
Monounsaturated fat
2.129g
0.202g
5%
Calcium
28mg
2mg
3%
Carbs
1.92g
0g
1%
Copper
0.128mg
0.14mg
1%
Manganese
0.013mg
1%
Protein per 100 calories
14g
15g
N/A
Calories per 10 g protein
71kcal
65kcal
N/A
Weight per 100 calories
49g
278g
N/A
Unsaturated / Saturated Fat ratio
3
2.5
N/A
Net carbs
1.92g
0g
N/A
Vitamin E
0.02mg
0%
Vitamin K
0.1µg
0%
Tryptophan
0.375mg
0%
Threonine
1.305mg
0%
Isoleucine
1.465mg
0%
Leucine
2.509mg
0%
Lysine
2.179mg
0%
Methionine
0.71mg
0%
Phenylalanine
1.401mg
0%
Valine
1.676mg
0%
Histidine
0.778mg
0%
Omega-3 - EPA
1.26g
0.007g
N/A
Omega-3 - DHA
1.747g
0.25g
N/A
Omega-3 - DPA
0.105g
0.021g
N/A
Macronutrient Comparison
Macronutrient breakdown side-by-side comparison
3
29%
8%
2%
59%
3%
Protein:
28.62 g
Fats:
8.23 g
Carbs:
1.92 g
Water:
58.63 g
Other:
2.6 g
2
6%
68%
25%
Protein:
5.5 g
Fats:
1.4 g
Carbs:
0 g
Water:
68 g
Other:
25.1 g
Contains
more
Protein Protein
+420.4%
Contains
more
Fats Fats
+487.9%
Contains
more
Carbs Carbs
+∞%
Contains
more
Water Water
+16%
Contains
more
Other Other
+865.4%
Fat Type Comparison
Fat type breakdown side-by-side comparison
2
25%
29%
46%
Saturated fat:
Sat. Fat
1.866 g
Monounsaturated fat:
Mono. Fat
2.129 g
Polyunsaturated fat:
Poly. Fat
3.404 g
1
29%
21%
50%
Saturated fat:
Sat. Fat
0.273 g
Monounsaturated fat:
Mono. Fat
0.202 g
Polyunsaturated fat:
Poly. Fat
0.475 g
Contains
more
Mono. Fat Monounsaturated fat
+954%
Contains
more
Poly. Fat Polyunsaturated fat
+616.6%
Contains
less
Sat. Fat Saturated fat
-85.4%