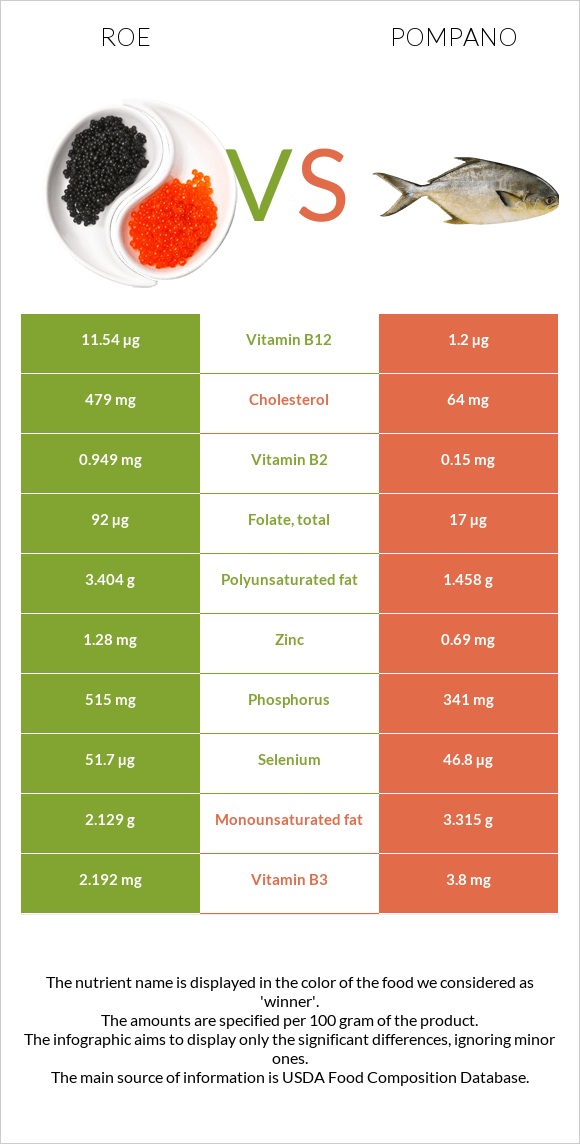
What are the main differences between roe and pompano? Roe is richer in vitamin B12, vitamin B2, phosphorus, folate, and vitamin C, while pompano is higher in vitamin B1, potassium, and vitamin B3. Roe's daily need coverage for vitamin B12 is 431% higher. Pompano is lower in cholesterol. Roe has a higher glycemic index (27) than pompano (0). We used Fish, roe, mixed species, cooked, dry heat and Fish, pompano, florida, cooked, dry heat types in this comparison.
Infographic
Mineral Comparison
Mineral comparison score is based on the number of minerals by which one or the other food is richer. The "coverage" charts below show how much of the daily needs can be covered by 300 grams of the food.
4
100 g
300 g
1 oz - 28.35g 3 oz - 85g
Magnesium
Magnesium
Calcium
Calcium
Potassium
Potassium
Iron
Iron
Copper
Copper
Zinc
Zinc
Phosphorus
Phosphorus
Sodium
Sodium
Manganese
Manganese
Selenium
Selenium
19%
8.4%
25%
29%
43%
35%
221%
15%
1.7%
282%
5
100 g
300 g
3 oz - 85g 1 fillet - 88g
Magnesium
Magnesium
Calcium
Calcium
Potassium
Potassium
Iron
Iron
Copper
Copper
Zinc
Zinc
Phosphorus
Phosphorus
Sodium
Sodium
Manganese
Manganese
Selenium
Selenium
22%
13%
56%
25%
26%
19%
146%
9.9%
3.3%
255%
Vitamin Comparison
Vitamin comparison score is based on the number of vitamins by which one or the other food is richer. The "coverage" charts below show how much of the daily needs can be covered by 300 grams of the food.
6
100 g
300 g
1 oz - 28.35g 3 oz - 85g
Vitamin C
Vit. C
Vitamin D
Vit. D
Vitamin A
Vit. A
Vitamin E
Vit. E
Vitamin B1
Vit. B1
Vitamin B2
Vit. B2
Vitamin B3
Vit. B3
Vitamin B5
Vit. B5
Vitamin B6
Vit. B6
Vitamin B12
Vit. B12
Vitamin K
Vit. K
Folate
Folate
55%
0%
30%
0%
69%
219%
41%
69%
43%
1443%
0%
69%
3
100 g
300 g
3 oz - 85g 1 fillet - 88g
Vitamin C
Vit. C
Vitamin D
Vit. D
Vitamin A
Vit. A
Vitamin E
Vit. E
Vitamin B1
Vit. B1
Vitamin B2
Vit. B2
Vitamin B3
Vit. B3
Vitamin B5
Vit. B5
Vitamin B6
Vit. B6
Vitamin B12
Vit. B12
Vitamin K
Vit. K
Folate
Folate
0%
0%
12%
0%
170%
35%
71%
52%
53%
150%
0%
13%
All nutrients comparison - raw data values
Nutrient
DV% diff.
Vitamin B12
11.54µg
1.2µg
431%
Cholesterol
479mg
64mg
138%
Vitamin B2
0.949mg
0.15mg
61%
Vitamin B1
0.277mg
0.68mg
34%
Phosphorus
515mg
341mg
25%
Folate
92µg
17µg
19%
Vitamin C
16.4mg
0mg
18%
Polyunsaturated fat
3.404g
1.458g
13%
Saturated fat
1.866g
4.499g
12%
Protein
28.62g
23.69g
10%
Potassium
283mg
636mg
10%
Vitamin B3
2.192mg
3.8mg
10%
Selenium
51.7µg
46.8µg
9%
Fats
8.23g
12.14g
6%
Copper
0.128mg
0.078mg
6%
Vitamin A
91µg
36µg
6%
Vitamin B5
1.154mg
0.87mg
6%
Zinc
1.28mg
0.69mg
5%
Vitamin B6
0.185mg
0.23mg
3%
Monounsaturated fat
2.129g
3.315g
3%
Calcium
28mg
43mg
2%
Sodium
117mg
76mg
2%
Carbs
1.92g
0g
1%
Magnesium
26mg
31mg
1%
Iron
0.77mg
0.67mg
1%
Manganese
0.013mg
0.025mg
1%
Calories
204kcal
211kcal
0%
Protein per 100 calories
14g
11g
N/A
Calories per 10 g protein
71kcal
89kcal
N/A
Weight per 100 calories
49g
47g
N/A
Unsaturated / Saturated Fat ratio
3
1.1
N/A
Net carbs
1.92g
0g
N/A
Tryptophan
0.375mg
0.265mg
0%
Threonine
1.305mg
1.038mg
0%
Isoleucine
1.465mg
1.092mg
0%
Leucine
2.509mg
1.925mg
0%
Lysine
2.179mg
2.175mg
0%
Methionine
0.71mg
0.701mg
0%
Phenylalanine
1.401mg
0.925mg
0%
Valine
1.676mg
1.22mg
0%
Histidine
0.778mg
0.697mg
0%
Omega-3 - EPA
1.26g
0.224g
N/A
Omega-3 - DHA
1.747g
0.504g
N/A
Omega-3 - DPA
0.105g
0.259g
N/A
Macronutrient Comparison
Macronutrient breakdown side-by-side comparison
3
29%
8%
2%
59%
3%
Protein:
28.62 g
Fats:
8.23 g
Carbs:
1.92 g
Water:
58.63 g
Other:
2.6 g
2
24%
12%
63%
Protein:
23.69 g
Fats:
12.14 g
Carbs:
0 g
Water:
62.97 g
Other:
1.2 g
Contains
more
Protein Protein
+20.8%
Contains
more
Carbs Carbs
+∞%
Contains
more
Other Other
+116.7%
Contains
more
Fats Fats
+47.5%
Fat Type Comparison
Fat type breakdown side-by-side comparison
2
25%
29%
46%
Saturated fat:
Sat. Fat
1.866 g
Monounsaturated fat:
Mono. Fat
2.129 g
Polyunsaturated fat:
Poly. Fat
3.404 g
1
49%
36%
16%
Saturated fat:
Sat. Fat
4.499 g
Monounsaturated fat:
Mono. Fat
3.315 g
Polyunsaturated fat:
Poly. Fat
1.458 g
Contains
less
Sat. Fat Saturated fat
-58.5%
Contains
more
Poly. Fat Polyunsaturated fat
+133.5%
Contains
more
Mono. Fat Monounsaturated fat
+55.7%