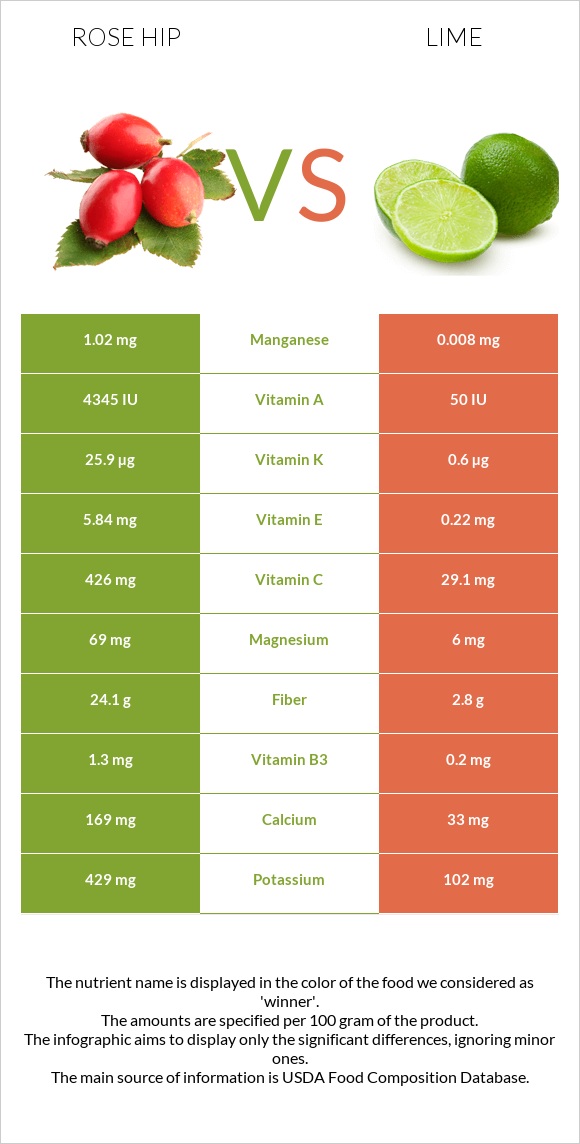
Important differences between rose hips and lime Lime has less vitamin C, vitamin A, fiber, manganese, vitamin E, vitamin K, magnesium, calcium, vitamin B5, and vitamin B2. Rose hips' daily need coverage for vitamin C is 441% more. Rose hips have 128 times more manganese than lime. Rose hips have 1.02mg of manganese, while lime has 0.008mg. Rose hips have a higher glycemic index than lime. The food varieties used in the comparison are Rose Hips, wild (Northern Plains Indians) and Limes, raw .
Infographic
Mineral Comparison
Mineral comparison score is based on the number of minerals by which one or the other food is richer. The "coverage" charts below show how much of the daily needs can be covered by 300 grams of the food.
8
100 g
300 g
1 cup - 127g
Magnesium
Magnesium
Calcium
Calcium
Potassium
Potassium
Iron
Iron
Copper
Copper
Zinc
Zinc
Phosphorus
Phosphorus
Sodium
Sodium
Manganese
Manganese
Selenium
Selenium
49%
51%
38%
40%
38%
6.8%
26%
0.52%
133%
0%
2
100 g
300 g
1 fruit (2" dia) - 67g 1 NLEA serving - 67g
Magnesium
Magnesium
Calcium
Calcium
Potassium
Potassium
Iron
Iron
Copper
Copper
Zinc
Zinc
Phosphorus
Phosphorus
Sodium
Sodium
Manganese
Manganese
Selenium
Selenium
4.3%
9.9%
9%
23%
22%
3%
7.7%
0.26%
1%
2.2%
Vitamin Comparison
Vitamin comparison score is based on the number of vitamins by which one or the other food is richer. The "coverage" charts below show how much of the daily needs can be covered by 300 grams of the food.
8
100 g
300 g
1 cup - 127g
Vitamin C
Vit. C
Vitamin D
Vit. D
Vitamin A
Vit. A
Vitamin E
Vit. E
Vitamin B1
Vit. B1
Vitamin B2
Vit. B2
Vitamin B3
Vit. B3
Vitamin B5
Vit. B5
Vitamin B6
Vit. B6
Vitamin B12
Vit. B12
Vitamin K
Vit. K
Folate
Folate
1420%
0%
72%
117%
4%
38%
24%
48%
18%
0%
65%
2.3%
2
100 g
300 g
1 fruit (2" dia) - 67g 1 NLEA serving - 67g
Vitamin C
Vit. C
Vitamin D
Vit. D
Vitamin A
Vit. A
Vitamin E
Vit. E
Vitamin B1
Vit. B1
Vitamin B2
Vit. B2
Vitamin B3
Vit. B3
Vitamin B5
Vit. B5
Vitamin B6
Vit. B6
Vitamin B12
Vit. B12
Vitamin K
Vit. K
Folate
Folate
97%
0%
0.67%
4.4%
7.5%
4.6%
3.8%
13%
9.9%
0%
1.5%
6%
All nutrients comparison - raw data values
Nutrient
DV% diff.
Vitamin C
426mg
29.1mg
441%
Fiber
24.1g
2.8g
85%
Manganese
1.02mg
0.008mg
44%
Vitamin E
5.84mg
0.22mg
37%
Vitamin A
217µg
2µg
24%
Vitamin K
25.9µg
0.6µg
21%
Magnesium
69mg
6mg
15%
Calcium
169mg
33mg
14%
Vitamin B5
0.8mg
0.217mg
12%
Vitamin B2
0.166mg
0.02mg
11%
Potassium
429mg
102mg
10%
Carbs
38.22g
10.54g
9%
Calories
162kcal
30kcal
7%
Vitamin B3
1.3mg
0.2mg
7%
Iron
1.06mg
0.6mg
6%
Phosphorus
61mg
18mg
6%
Copper
0.113mg
0.065mg
5%
Vitamin B6
0.076mg
0.043mg
3%
Protein
1.6g
0.7g
2%
Zinc
0.25mg
0.11mg
1%
Selenium
0.4µg
1%
Vitamin B1
0.016mg
0.03mg
1%
Folate
3µg
8µg
1%
Choline
12mg
5.1mg
1%
Fructose
1.16g
1%
Protein per 100 calories
0.99g
2.3g
N/A
Calories per 10 g protein
1013kcal
429kcal
N/A
Weight per 100 calories
62g
333g
N/A
Fats
0.34g
0.2g
0%
Net carbs
14.12g
7.74g
N/A
Sugar
2.58g
1.69g
N/A
Sodium
4mg
2mg
0%
Saturated fat
0.022g
0%
Monounsaturated fat
0.019g
0%
Polyunsaturated fat
0.055g
0%
Tryptophan
0.003mg
0%
Lysine
0.014mg
0%
Methionine
0.002mg
0%
Macronutrient Comparison
Macronutrient breakdown side-by-side comparison
4
38%
59%
Protein:
1.6 g
Fats:
0.34 g
Carbs:
38.22 g
Water:
58.66 g
Other:
1.18 g
1
11%
88%
Protein:
0.7 g
Fats:
0.2 g
Carbs:
10.54 g
Water:
88.26 g
Other:
0.3 g
Contains
more
Protein Protein
+128.6%
Contains
more
Fats Fats
+70%
Contains
more
Carbs Carbs
+262.6%
Contains
more
Other Other
+293.3%
Contains
more
Water Water
+50.5%