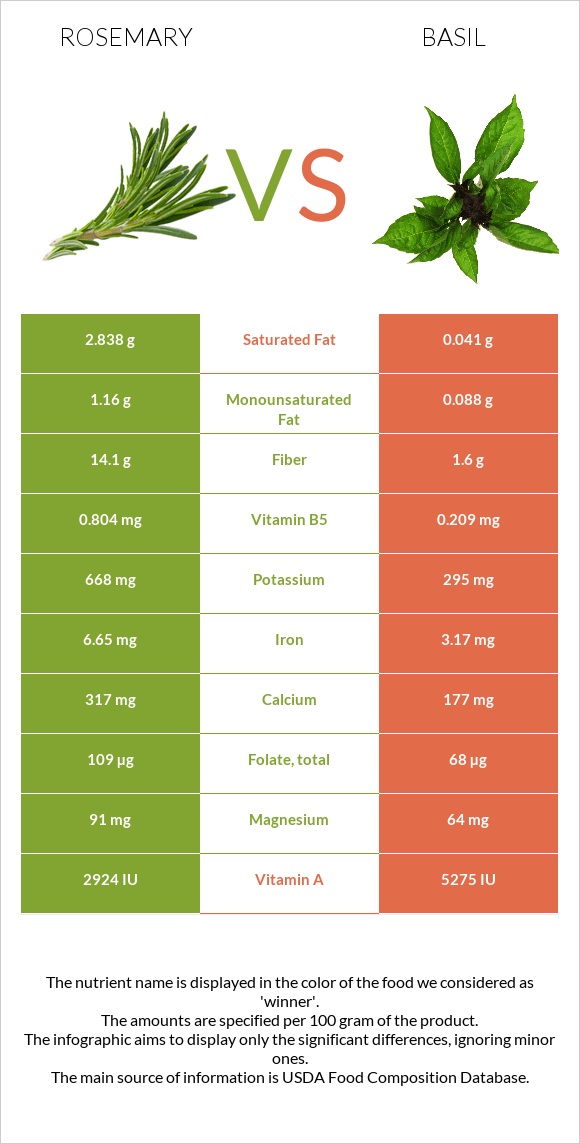
What are the differences between rosemary and basil? Rosemary is higher in fiber, iron, calcium, vitamin B6, vitamin B5, potassium, and folate, yet basil is higher in vitamin A and copper. Rosemary's daily need coverage for fiber is 50% more. Rosemary has 69 times more saturated fat than basil. While rosemary has 2.838g of saturated fat, basil has only 0.041g. We used Rosemary, fresh and Basil, fresh types in this article.
Infographic
Mineral Comparison
Mineral comparison score is based on the number of minerals by which one or the other food is richer. The "coverage" charts below show how much of the daily needs can be covered by 300 grams of the food.
6
100 g
300 g
1 tsp - 0.7g 1 tbsp - 1.7g
Magnesium
Magnesium
Calcium
Calcium
Potassium
Potassium
Iron
Iron
Copper
Copper
Zinc
Zinc
Phosphorus
Phosphorus
Sodium
Sodium
Manganese
Manganese
Selenium
Selenium
65%
95%
59%
249%
100%
25%
28%
3.4%
125%
0%
4
100 g
300 g
5 leaves - 2.5g 2 tbsp, chopped - 5.3g 0.25 cup leaves, whole - 6g
Magnesium
Magnesium
Calcium
Calcium
Potassium
Potassium
Iron
Iron
Copper
Copper
Zinc
Zinc
Phosphorus
Phosphorus
Sodium
Sodium
Manganese
Manganese
Selenium
Selenium
46%
53%
26%
119%
128%
22%
24%
0.52%
150%
1.6%
Vitamin Comparison
Vitamin comparison score is based on the number of vitamins by which one or the other food is richer. The "coverage" charts below show how much of the daily needs can be covered by 300 grams of the food.
5
100 g
300 g
1 tsp - 0.7g 1 tbsp - 1.7g
Vitamin C
Vit. C
Vitamin D
Vit. D
Vitamin A
Vit. A
Vitamin E
Vit. E
Vitamin B1
Vit. B1
Vitamin B2
Vit. B2
Vitamin B3
Vit. B3
Vitamin B5
Vit. B5
Vitamin B6
Vit. B6
Vitamin B12
Vit. B12
Vitamin K
Vit. K
Folate
Folate
73%
0%
49%
0%
9%
35%
17%
48%
78%
0%
0%
82%
3
100 g
300 g
5 leaves - 2.5g 2 tbsp, chopped - 5.3g 0.25 cup leaves, whole - 6g
Vitamin C
Vit. C
Vitamin D
Vit. D
Vitamin A
Vit. A
Vitamin E
Vit. E
Vitamin B1
Vit. B1
Vitamin B2
Vit. B2
Vitamin B3
Vit. B3
Vitamin B5
Vit. B5
Vitamin B6
Vit. B6
Vitamin B12
Vit. B12
Vitamin K
Vit. K
Folate
Folate
60%
0%
88%
16%
8.5%
18%
17%
13%
36%
0%
1037%
51%
All nutrients comparison - raw data values
Nutrient
DV% diff.
Vitamin K
414.8µg
346%
Fiber
14.1g
1.6g
50%
Iron
6.65mg
3.17mg
44%
Calcium
317mg
177mg
14%
Vitamin B6
0.336mg
0.155mg
14%
Vitamin A
146µg
264µg
13%
Saturated fat
2.838g
0.041g
13%
Vitamin B5
0.804mg
0.209mg
12%
Potassium
668mg
295mg
11%
Folate
109µg
68µg
10%
Copper
0.301mg
0.385mg
9%
Fats
5.86g
0.64g
8%
Manganese
0.96mg
1.148mg
8%
Carbs
20.7g
2.65g
6%
Magnesium
91mg
64mg
6%
Vitamin B2
0.152mg
0.076mg
6%
Calories
131kcal
23kcal
5%
Vitamin E
0.8mg
5%
Vitamin C
21.8mg
18mg
4%
Monounsaturated fat
1.16g
0.088g
3%
Polyunsaturated fat
0.901g
0.389g
3%
Choline
11.4mg
2%
Zinc
0.93mg
0.81mg
1%
Phosphorus
66mg
56mg
1%
Sodium
26mg
4mg
1%
Selenium
0.3µg
1%
Protein
3.31g
3.15g
0%
Protein per 100 calories
2.5g
14g
N/A
Calories per 10 g protein
396kcal
73kcal
N/A
Weight per 100 calories
76g
435g
N/A
Unsaturated / Saturated Fat ratio
0.73
12
N/A
Net carbs
6.6g
1.05g
N/A
Sugar
0.3g
N/A
Vitamin B1
0.036mg
0.034mg
0%
Vitamin B3
0.912mg
0.902mg
0%
Tryptophan
0.051mg
0.039mg
0%
Threonine
0.136mg
0.104mg
0%
Isoleucine
0.136mg
0.104mg
0%
Leucine
0.249mg
0.191mg
0%
Lysine
0.143mg
0.11mg
0%
Methionine
0.047mg
0.036mg
0%
Phenylalanine
0.169mg
0.13mg
0%
Valine
0.165mg
0.127mg
0%
Histidine
0.066mg
0.051mg
0%
Fructose
0.02g
0%
Macronutrient Comparison
Macronutrient breakdown side-by-side comparison
4
3%
6%
21%
68%
2%
Protein:
3.31 g
Fats:
5.86 g
Carbs:
20.7 g
Water:
67.77 g
Other:
2.36 g
1
3%
3%
92%
Protein:
3.15 g
Fats:
0.64 g
Carbs:
2.65 g
Water:
92.06 g
Other:
1.5 g
Contains
more
Fats Fats
+815.6%
Contains
more
Carbs Carbs
+681.1%
Contains
more
Other Other
+57.3%
Contains
more
Water Water
+35.8%
Fat Type Comparison
Fat type breakdown side-by-side comparison
2
58%
24%
18%
Saturated fat:
Sat. Fat
2.838 g
Monounsaturated fat:
Mono. Fat
1.16 g
Polyunsaturated fat:
Poly. Fat
0.901 g
1
8%
17%
75%
Saturated fat:
Sat. Fat
0.041 g
Monounsaturated fat:
Mono. Fat
0.088 g
Polyunsaturated fat:
Poly. Fat
0.389 g
Contains
more
Mono. Fat Monounsaturated fat
+1218.2%
Contains
more
Poly. Fat Polyunsaturated fat
+131.6%
Contains
less
Sat. Fat Saturated fat
-98.6%