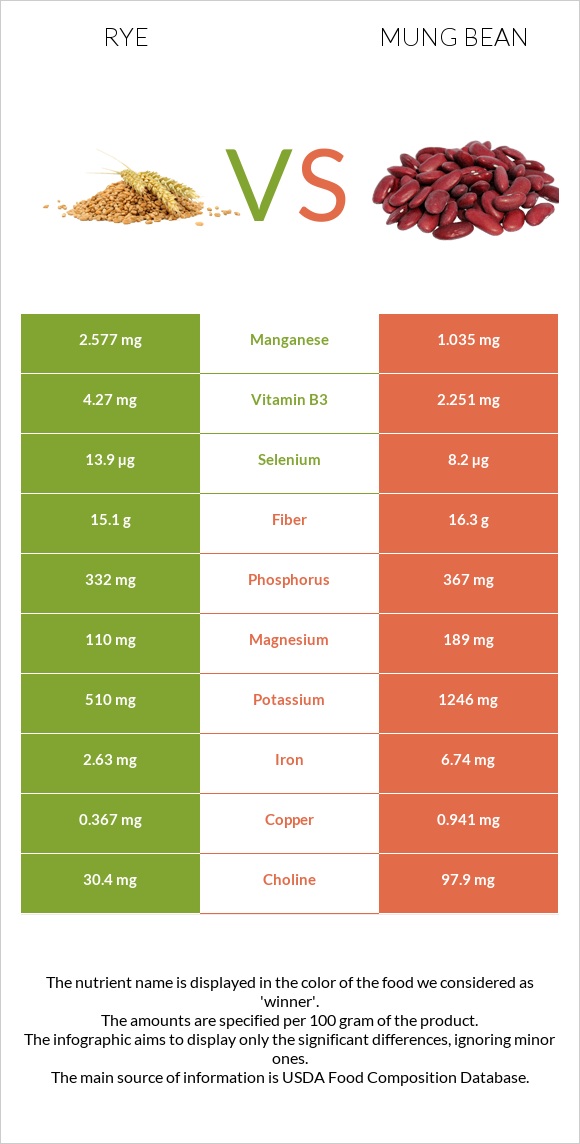
Important differences between rye and mung beans Rye has more manganese and vitamin B3; however, mung beans are richer in folate, copper, iron, vitamin B1, potassium, magnesium, choline, and calcium. Mung beans' daily need coverage for folate is 147% more. Rye contains 2 times more manganese than mung beans. Rye contains 2.577mg of manganese, while mung beans contain 1.035mg. The food varieties used in the comparison are Rye grain and Mung beans, mature seeds, raw .
Infographic
Mineral Comparison
Mineral comparison score is based on the number of minerals by which one or the other food is richer. The "coverage" charts below show how much of the daily needs can be covered by 300 grams of the food.
3
100 g
300 g
1 cup - 169g
Magnesium
Magnesium
Calcium
Calcium
Potassium
Potassium
Iron
Iron
Copper
Copper
Zinc
Zinc
Phosphorus
Phosphorus
Sodium
Sodium
Manganese
Manganese
Selenium
Selenium
79%
7.2%
45%
99%
122%
72%
142%
0.26%
336%
76%
6
100 g
300 g
1 tbsp - 13g 1 cup - 207g
Magnesium
Magnesium
Calcium
Calcium
Potassium
Potassium
Iron
Iron
Copper
Copper
Zinc
Zinc
Phosphorus
Phosphorus
Sodium
Sodium
Manganese
Manganese
Selenium
Selenium
135%
40%
110%
253%
314%
73%
157%
2%
135%
45%
Vitamin Comparison
Vitamin comparison score is based on the number of vitamins by which one or the other food is richer. The "coverage" charts below show how much of the daily needs can be covered by 300 grams of the food.
2
100 g
300 g
1 cup - 169g
Vitamin C
Vit. C
Vitamin D
Vit. D
Vitamin A
Vit. A
Vitamin E
Vit. E
Vitamin B1
Vit. B1
Vitamin B2
Vit. B2
Vitamin B3
Vit. B3
Vitamin B5
Vit. B5
Vitamin B6
Vit. B6
Vitamin B12
Vit. B12
Vitamin K
Vit. K
Folate
Folate
0%
0%
0.33%
17%
79%
58%
80%
87%
68%
0%
15%
29%
7
100 g
300 g
1 tbsp - 13g 1 cup - 207g
Vitamin C
Vit. C
Vitamin D
Vit. D
Vitamin A
Vit. A
Vitamin E
Vit. E
Vitamin B1
Vit. B1
Vitamin B2
Vit. B2
Vitamin B3
Vit. B3
Vitamin B5
Vit. B5
Vitamin B6
Vit. B6
Vitamin B12
Vit. B12
Vitamin K
Vit. K
Folate
Folate
16%
0%
2%
10%
155%
54%
42%
115%
88%
0%
23%
469%
All nutrients comparison - raw data values
Nutrient
DV% diff.
Folate
38µg
625µg
147%
Manganese
2.577mg
1.035mg
67%
Copper
0.367mg
0.941mg
64%
Iron
2.63mg
6.74mg
51%
Protein
10.34g
23.86g
27%
Vitamin B1
0.316mg
0.621mg
25%
Potassium
510mg
1246mg
22%
Magnesium
110mg
189mg
19%
Vitamin B3
4.27mg
2.251mg
13%
Choline
30.4mg
97.9mg
12%
Calcium
24mg
132mg
11%
Selenium
13.9µg
8.2µg
10%
Vitamin B5
1.456mg
1.91mg
9%
Vitamin B6
0.294mg
0.382mg
7%
Vitamin C
0mg
4.8mg
5%
Fiber
15.1g
16.3g
5%
Phosphorus
332mg
367mg
5%
Carbs
75.86g
62.62g
4%
Vitamin K
5.9µg
9µg
3%
Polyunsaturated fat
0.767g
0.384g
3%
Vitamin E
0.85mg
0.51mg
2%
Fats
1.63g
1.15g
1%
Sodium
2mg
15mg
1%
Vitamin A
1µg
6µg
1%
Vitamin B2
0.251mg
0.233mg
1%
Saturated fat
0.197g
0.348g
1%
Calories
338kcal
347kcal
0%
Protein per 100 calories
3.1g
6.9g
N/A
Calories per 10 g protein
327kcal
145kcal
N/A
Weight per 100 calories
30g
29g
N/A
Net carbs
60.76g
46.32g
N/A
Sugar
0.98g
6.6g
N/A
Zinc
2.65mg
2.68mg
0%
Monounsaturated fat
0.208g
0.161g
0%
Tryptophan
0.108mg
0.26mg
0%
Threonine
0.289mg
0.782mg
0%
Isoleucine
0.208mg
1.008mg
0%
Leucine
0.563mg
1.847mg
0%
Lysine
0.286mg
1.664mg
0%
Methionine
0.153mg
0.286mg
0%
Phenylalanine
0.435mg
1.443mg
0%
Valine
0.317mg
1.237mg
0%
Histidine
0.189mg
0.695mg
0%
Fructose
0.11g
0%
Macronutrient Comparison
Macronutrient breakdown side-by-side comparison
3
10%
76%
11%
Protein:
10.34 g
Fats:
1.63 g
Carbs:
75.86 g
Water:
10.6 g
Other:
1.57 g
2
24%
63%
9%
3%
Protein:
23.86 g
Fats:
1.15 g
Carbs:
62.62 g
Water:
9.05 g
Other:
3.32 g
Contains
more
Fats Fats
+41.7%
Contains
more
Carbs Carbs
+21.1%
Contains
more
Water Water
+17.1%
Contains
more
Protein Protein
+130.8%
Contains
more
Other Other
+111.5%
Fat Type Comparison
Fat type breakdown side-by-side comparison
3
17%
18%
65%
Saturated fat:
Sat. Fat
0.197 g
Monounsaturated fat:
Mono. Fat
0.208 g
Polyunsaturated fat:
Poly. Fat
0.767 g
0
39%
18%
43%
Saturated fat:
Sat. Fat
0.348 g
Monounsaturated fat:
Mono. Fat
0.161 g
Polyunsaturated fat:
Poly. Fat
0.384 g
Contains
less
Sat. Fat Saturated fat
-43.4%
Contains
more
Mono. Fat Monounsaturated fat
+29.2%
Contains
more
Poly. Fat Polyunsaturated fat
+99.7%