Saffron vs. Turmeric — Health Impact and Nutrition Comparison


Summary
Saffron is richer in magnesium, vitamin B1, vitamin B2, vitamin B6, folate, and vitamin C. In comparison, turmeric is richer iron, copper, zinc, potassium, calcium, magnesium, phosphorus, vitamin B5, vitamin E, and vitamin K.
Their macros are different. However, we consume them in low amounts, so it makes the macros insignificant.
Introduction
Turmeric is one of the main ingredients in the Indian kitchen. It has a golden yellow color and a bitter taste with a peppery flavor. Saffron also has yellow pigment, but it has a light flavor that is different from the flavor of turmeric.
In this article, we will dive deep into their differences regarding the general aspects, nutritional content, and health impacts.
Uses
Turmeric and saffron are essential for several classic dishes because of their bright colors and flavor. In the Indian kitchen, turmeric is one of the main ingredients in curry and vegetable curry. Saffron is widely used in many traditional European and Persian dishes, such as baghali polo, paellas, and pilafs.
Price
Saffron is a costly spice. The cost falls in the range of 500 to 5.000 U.S. dollars for 450 grams. This spice is so expensive because of its labor-intensive harvesting method, making the production costly.
Turmeric is a cheaper spice comparatively.
Nutrition
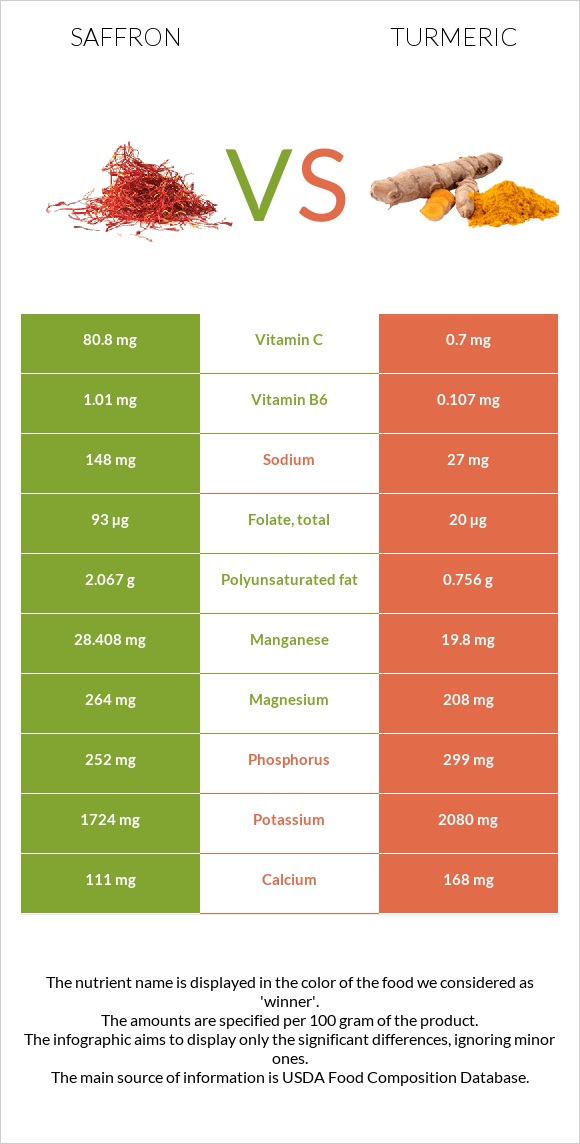
In this section of the article, you can find a detailed nutritional description of turmeric and saffron. Please find a nutrition infographic at the bottom of this page that visually shows the main differences between these spices.
Since we are consuming these as spices in very low amounts, their macronutrient amount and fiber content does not have much significance. However, we will include them in this comparison.
Micronutrients
In comparison, turmeric contains more fiber and carbs, while saffron is higher in fats and protein. The amounts of saturated and polyunsaturated fat are also higher in saffron. Both contain no cholesterol.
We consume very low amounts that these are mostly insignificant.
Vitamins
Saffron is vitamin dense compared to turmeric. Saffron is richer in vitamin B1, vitamin B2, vitamin B6, folate, and vitamin C. In comparison, turmeric is richer in vitamin B5, vitamin E, and vitamin K.
Vitamin Comparison
Contains
more
Vitamin CVitamin C
+11442.9%
Contains
more
Vitamin AVitamin A
+∞%
Contains
more
Vitamin B1Vitamin B1
+98.3%
Contains
more
Vitamin B2Vitamin B2
+78%
Contains
more
Vitamin B6Vitamin B6
+843.9%
Contains
more
FolateFolate
+365%
Minerals
Tumeric has a higher mineral content than saffron. It has three times more iron, copper and zinc, potassium, calcium, magnesium, and phosphorus than saffron. It also contains less sodium than saffron. On the other hand, saffron has a higher magnesium level than turmeric.
Mineral Comparison
Contains
more
MagnesiumMagnesium
+26.9%
Contains
more
ManganeseManganese
+43.5%
Contains
more
CalciumCalcium
+51.4%
Contains
more
PotassiumPotassium
+20.6%
Contains
more
IronIron
+395.5%
Contains
more
CopperCopper
+296.3%
Contains
more
ZincZinc
+312.8%
Contains
more
PhosphorusPhosphorus
+18.7%
Contains
less
SodiumSodium
-81.8%
Contains
more
SeleniumSelenium
+10.7%
Glycemic Index
The glycemic index of turmeric is much lower than that of saffron. The GI of turmeric is equal to 0, whereas saffron has a GI equal to 70. Turmeric is considered a low glycemic index food.
However, the glycemic load of saffron is much lower because the serving size is 0.5, making the glycemic load low.
Acidity
On average, both spices are way alkaline. However, the acidity of turmeric is higher than that of saffron. It has a pH equal to 35.5, whereas saffron has a pH equal to 29.6. That means, Taking these spices in high amounts may increase your risk of indigestion and nausea.
Calories
The number of calories of these spices is almost equal. Turmeric contains 312 calories per 100 g, and saffron has 310 calories per 100 g. However, people often consume these spices in minor quantities, so calories will not matter so much.
You can read about saffron vs. safflower in this article.
Health Benefits
Anti-inflammatory Effects
Turmeric contains bioactive compounds that are called curcumin. Curcumin is a potent antioxidant that also has anti-inflammatory effects. Studies suggest that the daily intake of curcumin should be 1 gram, which may be challenging to reach if you use turmeric spice only. To get this dosage daily, you need to consume different types of foods rich in curcumin, and they are mostly from the ginger family (1).
Saffron is also a good source of potent antioxidants that have anti-inflammatory effects as well. Saffron contains kaempferol, a compound that may help to reduce inflammation (2).
Weight Loss
According to the study, taking a saffron extract may help people with coronary artery disease by reducing their body mass index, total fat mass, and waist circumference. The study showed that people who took the supplement also had a reduced appetite. Cooking with saffron is an easy way to add it to your diet without the risk of consuming too much of it (3).
Cancer
Turmeric is an excellent source of curcumin. In vitro and animal studies show that curcumin can reduce the growth of cancer cells. It can contribute to the death of cancer cells and reduce angiogenesis (4). On the other hand, saffron contains powerful antioxidants, including crocin, picrocrocin, and safranal, which help fight against oxidative stress and free radicals. Free radicals can damage human cells, leading to several types of cancer (5).
Diabetes
According to the study, saffron extract can reduce hyperglycemia and hyperlipidemia risk in diabetic rats (6). Another study showed that saffron could lower blood sugar levels and raise insulin sensitivity (7). Nevertheless, more research is needed. Turmeric may help with blood sugar management in type 2 diabetes because of its anti-inflammatory and antioxidant effects. According to the study, turmeric extract may help stabilize blood sugar levels and make diabetes more manageable (8).
Cardiovascular Health
Both saffron and turmeric have been studied for their potential cardiovascular benefits, although they have different active compounds and mechanisms of action.
Saffron contains several bioactive compounds, which have been shown to have antioxidant, anti-inflammatory, and cardioprotective effects. Studies suggest that saffron may help reduce blood pressure, improve lipid profile by increasing HDL (“good ”cholesterol) and decreasing triglycerides, and enhance endothelial function, which is important for maintaining healthy blood vessels. These effects collectively contribute to saffron's potential cardioprotective properties (9, 10).
Turmeric is rich in curcumin, which is its primary bioactive compound. Curcumin has been extensively studied for its anti-inflammatory, antioxidant, and cardioprotective properties. It has been shown to reduce inflammation, oxidative stress, and plaque buildup in arteries, which are all risk factors for cardiovascular disease. Additionally, curcumin may help improve endothelial function and reduce blood clot formation (11).
Aphrodisiac Effect
According to the study, a daily intake of 30 mg of saffron for four weeks may improve erectile function over placebo in men with antidepressant-related erectile dysfunction (12). On the other hand, turmeric may also help to treat erectile dysfunction. According to the study, a topical ointment made from curcumin can reduce inflammation, increase blood flow to the groin, and improve vasodilation (13).
Downside and Risks
Saffron is possibly safe in small amounts. However, excessive consumption of saffron is harmful and causes vomiting, decreased heart rate, dizziness, lethargy, yellowing of the skin, and other dangerous complications that can even lead to death.
Turmeric usually doesn't cause serious side effects. Some people can have side effects such as stomach upset, dizziness, or diarrhea in rare cases. These side effects can be common only at higher doses (14) (15).
References
- https://pubmed.ncbi.nlm.nih.gov/17044766/
- https://pubmed.ncbi.nlm.nih.gov/23497863/
- h286368958_Saffron_A_Functional_Spicettps://www.researchgate.net/publication/
- https://www.ncbi.nlm.nih.gov/pmc/articles/PMC2758121/
- https://www.ingentaconnect.com/content/ben/acamc/2019/00000019/00000001/art00009
- https://www.hindawi.com/journals/bmri/2014/920857/
- https://pubmed.ncbi.nlm.nih.gov/22980812/
- https://www.ncbi.nlm.nih.gov/pmc/articles/PMC3857752/
- https://pubmed.ncbi.nlm.nih.gov/31779990/
- https://pubmed.ncbi.nlm.nih.gov/29524452/
- https://www.sciencedirect.com/science/article/pii/S0753332220314074
- https://pubmed.ncbi.nlm.nih.gov/22552758/
- https://www.sciencedirect.com/science/article/abs/pii/S1743609518301838
- https://pubmed.ncbi.nlm.nih.gov/26877844/
- https://pubmed.ncbi.nlm.nih.gov/25853978/

Infographic
All nutrients comparison - raw data values
| Nutrient | |
|
DV% diff. |
| Iron | 11.1mg | 55mg | 549% |
| Manganese | 28.408mg | 19.8mg | 374% |
| Copper | 0.328mg | 1.3mg | 108% |
| Vitamin C | 80.8mg | 0.7mg | 89% |
| Fiber | 3.9g | 22.7g | 75% |
| Vitamin B6 | 1.01mg | 0.107mg | 69% |
| Zinc | 1.09mg | 4.5mg | 31% |
| Vitamin E | 4.43mg | 30% | |
| Folate | 93µg | 20µg | 18% |
| Magnesium | 264mg | 208mg | 13% |
| Vitamin B5 | 0.542mg | 11% | |
| Vitamin K | 13.4µg | 11% | |
| Potassium | 1724mg | 2080mg | 10% |
| Vitamin B2 | 0.267mg | 0.15mg | 9% |
| Choline | 49.2mg | 9% | |
| Polyunsaturated fat | 2.067g | 0.756g | 9% |
| Phosphorus | 252mg | 299mg | 7% |
| Calcium | 111mg | 168mg | 6% |
| Sodium | 148mg | 27mg | 5% |
| Vitamin B1 | 0.115mg | 0.058mg | 5% |
| Protein | 11.43g | 9.68g | 4% |
| Fats | 5.85g | 3.25g | 4% |
| Vitamin A | 27µg | 0µg | 3% |
| Carbs | 65.37g | 67.14g | 1% |
| Selenium | 5.6µg | 6.2µg | 1% |
| Vitamin B3 | 1.46mg | 1.35mg | 1% |
| Saturated fat | 1.586g | 1.838g | 1% |
| Fructose | 0.45g | 1% | |
| Calories | 310kcal | 312kcal | 0% |
| Protein per 100 calories | 3.7g | 3.1g | N/A |
| Calories per 10 g protein | 271kcal | 322kcal | N/A |
| Weight per 100 calories | 32g | 32g | N/A |
| Unsaturated / Saturated Fat ratio | 1.6 | 0.66 | N/A |
| Net carbs | 61.47g | 44.44g | N/A |
| Sugar | 3.21g | N/A | |
| Trans fat | 0g | 0.056g | N/A |
| Monounsaturated fat | 0.429g | 0.449g | 0% |
| Tryptophan | 0.17mg | 0% | |
| Threonine | 0.33mg | 0% | |
| Isoleucine | 0.47mg | 0% | |
| Leucine | 0.81mg | 0% | |
| Lysine | 0.38mg | 0% | |
| Methionine | 0.14mg | 0% | |
| Phenylalanine | 0.53mg | 0% | |
| Valine | 0.66mg | 0% | |
| Histidine | 0.15mg | 0% | |
| Omega-3 - ALA | 0.003g | N/A | |
| Omega-3 - DPA | 0.006g | 0g | N/A |
| Omega-6 - Gamma-linoleic acid | 0.081g | N/A |
Macronutrient Comparison
| Contains more ProteinProtein | +18.1% |
| Contains more FatsFats | +80% |
| Contains more OtherOther | +29.9% |
Fat Type Comparison
| Contains less Sat. FatSaturated fat | -13.7% |
| Contains more Poly. FatPolyunsaturated fat | +173.4% |
People also compare


References
All the values for which the sources are not specified explicitly are taken from FDA’s Food Central. The exact link to the food presented on this page can be found below.
- Saffron - https://fdc.nal.usda.gov/fdc-app.html#/food-details/170934/nutrients
- Turmeric - https://fdc.nal.usda.gov/fdc-app.html#/food-details/172231/nutrients
All the Daily Values are presented for males aged 31-50, for 2000-calorie diets.