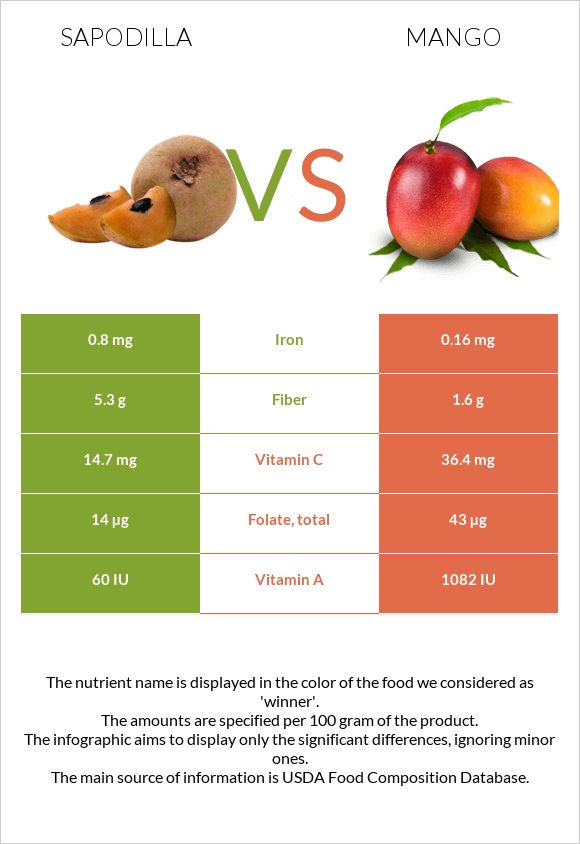
How are sapodillas and mango different? Sapodillas are higher in fiber and iron; however, mango is richer in vitamin C, vitamin A, folate, and vitamin B6. Daily need coverage for vitamin C for mango is 24% higher. Sapodillas contain 5 times more iron than mango. While sapodillas contain 0.8mg of iron, mango contains only 0.16mg. Sapodillas have a lower glycemic index (37) than mango (51). Sapodilla, raw and Mangos, raw are the varieties used in this article.
Infographic
Mineral Comparison
Mineral comparison score is based on the number of minerals by which one or the other food is richer. The "coverage" charts below show how much of the daily needs can be covered by 300 grams of the food.
4
100 g
300 g
1 sapodilla - 170g 1 cup, pulp - 241g
Magnesium
Magnesium
Calcium
Calcium
Potassium
Potassium
Iron
Iron
Copper
Copper
Zinc
Zinc
Phosphorus
Phosphorus
Sodium
Sodium
Manganese
Manganese
Selenium
Selenium
8.6%
6.3%
17%
30%
29%
2.7%
5.1%
1.6%
0%
3.3%
4
100 g
300 g
1 cup pieces - 165g 1 fruit without refuse - 336g
Magnesium
Magnesium
Calcium
Calcium
Potassium
Potassium
Iron
Iron
Copper
Copper
Zinc
Zinc
Phosphorus
Phosphorus
Sodium
Sodium
Manganese
Manganese
Selenium
Selenium
7.1%
3.3%
15%
6%
37%
2.5%
6%
0.13%
8.2%
3.3%
Vitamin Comparison
Vitamin comparison score is based on the number of vitamins by which one or the other food is richer. The "coverage" charts below show how much of the daily needs can be covered by 300 grams of the food.
1
100 g
300 g
1 sapodilla - 170g 1 cup, pulp - 241g
Vitamin C
Vit. C
Vitamin D
Vit. D
Vitamin A
Vit. A
Vitamin E
Vit. E
Vitamin B1
Vit. B1
Vitamin B2
Vit. B2
Vitamin B3
Vit. B3
Vitamin B5
Vit. B5
Vitamin B6
Vit. B6
Vitamin B12
Vit. B12
Vitamin K
Vit. K
Folate
Folate
49%
0%
1%
0%
0%
4.6%
3.8%
15%
8.5%
0%
0%
11%
9
100 g
300 g
1 cup pieces - 165g 1 fruit without refuse - 336g
Vitamin C
Vit. C
Vitamin D
Vit. D
Vitamin A
Vit. A
Vitamin E
Vit. E
Vitamin B1
Vit. B1
Vitamin B2
Vit. B2
Vitamin B3
Vit. B3
Vitamin B5
Vit. B5
Vitamin B6
Vit. B6
Vitamin B12
Vit. B12
Vitamin K
Vit. K
Folate
Folate
121%
0%
18%
18%
7%
8.8%
13%
12%
27%
0%
11%
32%
All nutrients comparison - raw data values
Nutrient
DV% diff.
Vitamin C
14.7mg
36.4mg
24%
Fiber
5.3g
1.6g
15%
Iron
0.8mg
0.16mg
8%
Folate
14µg
43µg
7%
Vitamin A
3µg
54µg
6%
Vitamin E
0.9mg
6%
Vitamin B6
0.037mg
0.119mg
6%
Fructose
4.68g
6%
Vitamin K
4.2µg
4%
Copper
0.086mg
0.111mg
3%
Manganese
0.063mg
3%
Vitamin B3
0.2mg
0.669mg
3%
Carbs
19.96g
14.98g
2%
Vitamin B1
0mg
0.028mg
2%
Calories
83kcal
60kcal
1%
Protein
0.44g
0.82g
1%
Fats
1.1g
0.38g
1%
Calcium
21mg
11mg
1%
Potassium
193mg
168mg
1%
Vitamin B2
0.02mg
0.038mg
1%
Vitamin B5
0.252mg
0.197mg
1%
Choline
7.6mg
1%
Monounsaturated fat
0.521g
0.14g
1%
Protein per 100 calories
0.53g
1.4g
N/A
Calories per 10 g protein
1886kcal
732kcal
N/A
Weight per 100 calories
120g
167g
N/A
Net carbs
14.66g
13.38g
N/A
Magnesium
12mg
10mg
0%
Sugar
13.66g
N/A
Zinc
0.1mg
0.09mg
0%
Phosphorus
12mg
14mg
0%
Sodium
12mg
1mg
0%
Selenium
0.6µg
0.6µg
0%
Saturated fat
0.194g
0.092g
0%
Polyunsaturated fat
0.011g
0.071g
0%
Tryptophan
0.005mg
0.013mg
0%
Threonine
0.012mg
0.031mg
0%
Isoleucine
0.015mg
0.029mg
0%
Leucine
0.024mg
0.05mg
0%
Lysine
0.039mg
0.066mg
0%
Methionine
0.003mg
0.008mg
0%
Phenylalanine
0.013mg
0.027mg
0%
Valine
0.016mg
0.042mg
0%
Histidine
0.016mg
0.019mg
0%
Macronutrient Comparison
Macronutrient breakdown side-by-side comparison
3
20%
78%
Protein:
0.44 g
Fats:
1.1 g
Carbs:
19.96 g
Water:
78 g
Other:
0.5 g
2
15%
83%
Protein:
0.82 g
Fats:
0.38 g
Carbs:
14.98 g
Water:
83.46 g
Other:
0.36 g
Contains
more
Fats Fats
+189.5%
Contains
more
Carbs Carbs
+33.2%
Contains
more
Other Other
+38.9%
Contains
more
Protein Protein
+86.4%
Fat Type Comparison
Fat type breakdown side-by-side comparison
1
27%
72%
Saturated fat:
Sat. Fat
0.194 g
Monounsaturated fat:
Mono. Fat
0.521 g
Polyunsaturated fat:
Poly. Fat
0.011 g
2
30%
46%
23%
Saturated fat:
Sat. Fat
0.092 g
Monounsaturated fat:
Mono. Fat
0.14 g
Polyunsaturated fat:
Poly. Fat
0.071 g
Contains
more
Mono. Fat Monounsaturated fat
+272.1%
Contains
less
Sat. Fat Saturated fat
-52.6%
Contains
more
Poly. Fat Polyunsaturated fat
+545.5%