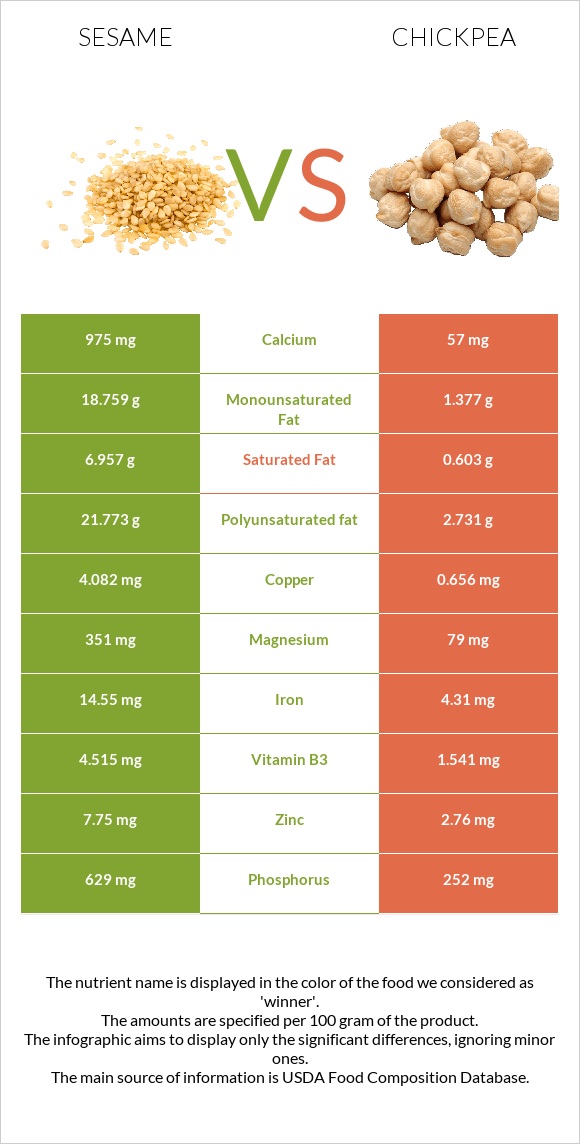
Significant differences between sesame and chickpeas The amount of copper, iron, calcium, magnesium, phosphorus, manganese, zinc, vitamin B1, selenium, and vitamin B6 in sesame is higher than in chickpeas. Sesame covers your daily copper needs 414% more than chickpeas. Chickpeas have 20 times less calcium than sesame. Sesame has 975mg of calcium, while chickpeas have 49mg. Specific food types used in this comparison are Seeds, sesame seeds, whole, dried and Chickpeas (garbanzo beans, bengal gram), mature seeds, cooked, boiled, without salt .
Infographic
Mineral Comparison
Mineral comparison score is based on the number of minerals by which one or the other food is richer. The "coverage" charts below show how much of the daily needs can be covered by 300 grams of the food.
9
100 g
300 g
1 tbsp - 9g 1 cup - 144g
Magnesium
Magnesium
Calcium
Calcium
Potassium
Potassium
Iron
Iron
Copper
Copper
Zinc
Zinc
Phosphorus
Phosphorus
Sodium
Sodium
Manganese
Manganese
Selenium
Selenium
251%
293%
41%
546%
1361%
211%
270%
1.4%
321%
188%
1
100 g
300 g
1 cup - 164g
Magnesium
Magnesium
Calcium
Calcium
Potassium
Potassium
Iron
Iron
Copper
Copper
Zinc
Zinc
Phosphorus
Phosphorus
Sodium
Sodium
Manganese
Manganese
Selenium
Selenium
34%
15%
26%
108%
117%
42%
72%
0.91%
134%
20%
Vitamin Comparison
Vitamin comparison score is based on the number of vitamins by which one or the other food is richer. The "coverage" charts below show how much of the daily needs can be covered by 300 grams of the food.
4
100 g
300 g
1 tbsp - 9g 1 cup - 144g
Vitamin C
Vit. C
Vitamin D
Vit. D
Vitamin A
Vit. A
Vitamin E
Vit. E
Vitamin B1
Vit. B1
Vitamin B2
Vit. B2
Vitamin B3
Vit. B3
Vitamin B5
Vit. B5
Vitamin B6
Vit. B6
Vitamin B12
Vit. B12
Vitamin K
Vit. K
Folate
Folate
0%
0%
0%
5%
198%
57%
85%
3%
182%
0%
0%
73%
6
100 g
300 g
1 cup - 164g
Vitamin C
Vit. C
Vitamin D
Vit. D
Vitamin A
Vit. A
Vitamin E
Vit. E
Vitamin B1
Vit. B1
Vitamin B2
Vit. B2
Vitamin B3
Vit. B3
Vitamin B5
Vit. B5
Vitamin B6
Vit. B6
Vitamin B12
Vit. B12
Vitamin K
Vit. K
Folate
Folate
4.3%
0%
0.33%
7%
29%
15%
9.9%
17%
32%
0%
10%
129%
All nutrients comparison - raw data values
Nutrient
DV% diff.
Copper
4.082mg
0.352mg
414%
Iron
14.55mg
2.89mg
146%
Polyunsaturated fat
21.773g
1.156g
137%
Calcium
975mg
49mg
93%
Fats
49.67g
2.59g
72%
Magnesium
351mg
48mg
72%
Phosphorus
629mg
168mg
66%
Manganese
2.46mg
1.03mg
62%
Zinc
7.75mg
1.53mg
57%
Selenium
34.4µg
3.7µg
56%
Vitamin B1
0.791mg
0.116mg
56%
Vitamin B6
0.79mg
0.139mg
50%
Monounsaturated fat
18.759g
0.583g
45%
Saturated fat
6.957g
0.269g
30%
Vitamin B3
4.515mg
0.526mg
25%
Calories
573kcal
164kcal
20%
Folate
97µg
172µg
19%
Protein
17.73g
8.86g
18%
Fiber
11.8g
7.6g
17%
Vitamin B2
0.247mg
0.063mg
14%
Potassium
468mg
291mg
5%
Vitamin B5
0.05mg
0.286mg
5%
Vitamin K
0µg
4µg
3%
Choline
25.6mg
42.8mg
3%
Vitamin C
0mg
1.3mg
1%
Carbs
23.45g
27.42g
1%
Vitamin E
0.25mg
0.35mg
1%
Protein per 100 calories
3.1g
5.4g
N/A
Calories per 10 g protein
323kcal
185kcal
N/A
Weight per 100 calories
17g
61g
N/A
Unsaturated / Saturated Fat ratio
5.8
6.5
N/A
Net carbs
11.65g
19.82g
N/A
Sugar
0.3g
4.8g
N/A
Sodium
11mg
7mg
0%
Vitamin A
0µg
1µg
0%
Tryptophan
0.388mg
0.085mg
0%
Threonine
0.736mg
0.329mg
0%
Isoleucine
0.763mg
0.38mg
0%
Leucine
1.358mg
0.631mg
0%
Lysine
0.569mg
0.593mg
0%
Methionine
0.586mg
0.116mg
0%
Phenylalanine
0.94mg
0.475mg
0%
Valine
0.99mg
0.372mg
0%
Histidine
0.522mg
0.244mg
0%
Macronutrient Comparison
Macronutrient breakdown side-by-side comparison
3
18%
50%
23%
5%
4%
Protein:
17.73 g
Fats:
49.67 g
Carbs:
23.45 g
Water:
4.69 g
Other:
4.46 g
2
9%
3%
27%
60%
Protein:
8.86 g
Fats:
2.59 g
Carbs:
27.42 g
Water:
60.21 g
Other:
0.92 g
Contains
more
Protein Protein
+100.1%
Contains
more
Fats Fats
+1817.8%
Contains
more
Other Other
+384.8%
Contains
more
Carbs Carbs
+16.9%
Contains
more
Water Water
+1183.8%
Fat Type Comparison
Fat type breakdown side-by-side comparison
2
15%
40%
46%
Saturated fat:
Sat. Fat
6.957 g
Monounsaturated fat:
Mono. Fat
18.759 g
Polyunsaturated fat:
Poly. Fat
21.773 g
1
13%
29%
58%
Saturated fat:
Sat. Fat
0.269 g
Monounsaturated fat:
Mono. Fat
0.583 g
Polyunsaturated fat:
Poly. Fat
1.156 g
Contains
more
Mono. Fat Monounsaturated fat
+3117.7%
Contains
more
Poly. Fat Polyunsaturated fat
+1783.5%
Contains
less
Sat. Fat Saturated fat
-96.1%