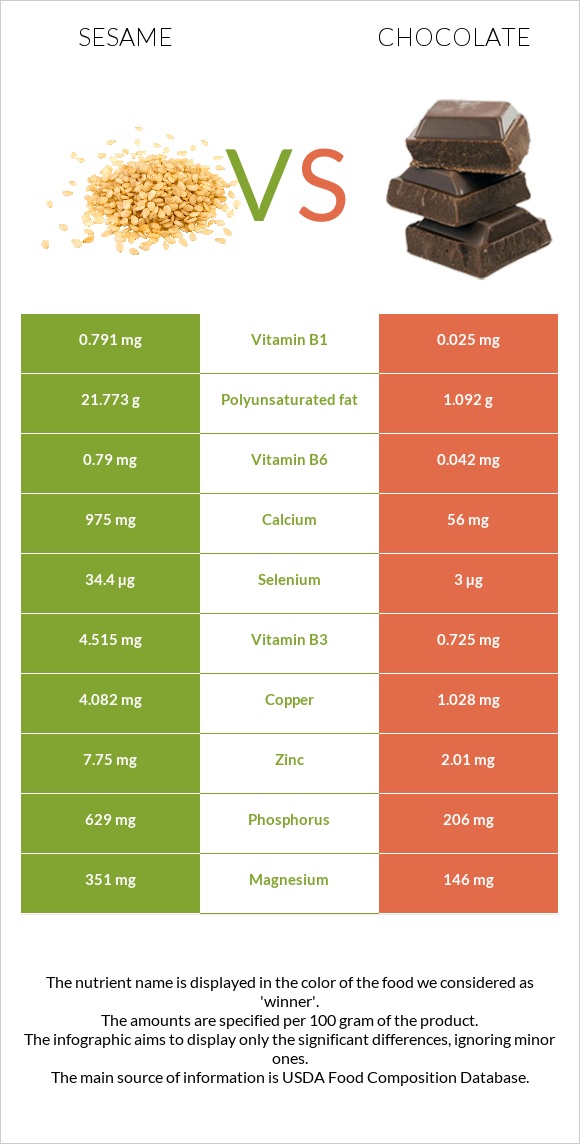
A recap on the differences between sesame and chocolate Chocolate has less copper, calcium, iron, vitamin B1, phosphorus, vitamin B6, selenium, zinc, and magnesium. Sesame covers your daily copper needs 339% more than chocolate. Chocolate contains 32 times less vitamin B1 than sesame. Sesame contains 0.791mg of vitamin B1, while chocolate contains 0.025mg. Sesame has less saturated fat. Food varieties used in this article are Seeds, sesame seeds, whole, dried and Chocolate, dark, 45- 59% cacao solids .
Infographic
Mineral Comparison
Mineral comparison score is based on the number of minerals by which one or the other food is richer. The "coverage" charts below show how much of the daily needs can be covered by 300 grams of the food.
9
100 g
300 g
1 tbsp - 9g 1 cup - 144g
Magnesium
Magnesium
Calcium
Calcium
Potassium
Potassium
Iron
Iron
Copper
Copper
Zinc
Zinc
Phosphorus
Phosphorus
Sodium
Sodium
Manganese
Manganese
Selenium
Selenium
251%
293%
41%
546%
1361%
211%
270%
1.4%
321%
188%
1
100 g
300 g
1 oz - 28.35g 1 bar - 162g
Magnesium
Magnesium
Calcium
Calcium
Potassium
Potassium
Iron
Iron
Copper
Copper
Zinc
Zinc
Phosphorus
Phosphorus
Sodium
Sodium
Manganese
Manganese
Selenium
Selenium
104%
17%
49%
301%
343%
55%
88%
3.1%
185%
16%
Vitamin Comparison
Vitamin comparison score is based on the number of vitamins by which one or the other food is richer. The "coverage" charts below show how much of the daily needs can be covered by 300 grams of the food.
5
100 g
300 g
1 tbsp - 9g 1 cup - 144g
Vitamin C
Vit. C
Vitamin D
Vit. D
Vitamin A
Vit. A
Vitamin E
Vit. E
Vitamin B1
Vit. B1
Vitamin B2
Vit. B2
Vitamin B3
Vit. B3
Vitamin B5
Vit. B5
Vitamin B6
Vit. B6
Vitamin B12
Vit. B12
Vitamin K
Vit. K
Folate
Folate
0%
0%
0%
5%
198%
57%
85%
3%
182%
0%
0%
73%
5
100 g
300 g
1 oz - 28.35g 1 bar - 162g
Vitamin C
Vit. C
Vitamin D
Vit. D
Vitamin A
Vit. A
Vitamin E
Vit. E
Vitamin B1
Vit. B1
Vitamin B2
Vit. B2
Vitamin B3
Vit. B3
Vitamin B5
Vit. B5
Vitamin B6
Vit. B6
Vitamin B12
Vit. B12
Vitamin K
Vit. K
Folate
Folate
0%
0%
0.67%
11%
6.3%
12%
14%
18%
9.7%
29%
20%
0%
All nutrients comparison - raw data values
Nutrient
DV% diff.
Copper
4.082mg
1.028mg
339%
Polyunsaturated fat
21.773g
1.092g
138%
Calcium
975mg
56mg
92%
Iron
14.55mg
8.02mg
82%
Vitamin B1
0.791mg
0.025mg
64%
Phosphorus
629mg
206mg
60%
Vitamin B6
0.79mg
0.042mg
58%
Selenium
34.4µg
3µg
57%
Saturated fat
6.957g
18.519g
53%
Zinc
7.75mg
2.01mg
52%
Magnesium
351mg
146mg
49%
Manganese
2.46mg
1.419mg
45%
Fats
49.67g
31.28g
28%
Protein
17.73g
4.88g
26%
Vitamin B3
4.515mg
0.725mg
24%
Folate
97µg
24%
Monounsaturated fat
18.759g
9.54g
23%
Fiber
11.8g
7g
19%
Vitamin B2
0.247mg
0.05mg
15%
Carbs
23.45g
61.17g
13%
Caffeine
0mg
43mg
11%
Vitamin B12
0µg
0.23µg
10%
Vitamin K
0µg
8.1µg
7%
Vitamin B5
0.05mg
0.297mg
5%
Choline
25.6mg
5%
Cholesterol
0mg
8mg
3%
Potassium
468mg
559mg
3%
Vitamin E
0.25mg
0.54mg
2%
Calories
573kcal
546kcal
1%
Sodium
11mg
24mg
1%
Protein per 100 calories
3.1g
0.89g
N/A
Calories per 10 g protein
323kcal
1119kcal
N/A
Weight per 100 calories
17g
18g
N/A
Unsaturated / Saturated Fat ratio
5.8
0.57
N/A
Net carbs
11.65g
54.17g
N/A
Sugar
0.3g
47.9g
N/A
Vitamin A
0µg
2µg
0%
Trans fat
0.112g
N/A
Tryptophan
0.388mg
0%
Threonine
0.736mg
0%
Isoleucine
0.763mg
0%
Leucine
1.358mg
0%
Lysine
0.569mg
0%
Methionine
0.586mg
0%
Phenylalanine
0.94mg
0%
Valine
0.99mg
0%
Histidine
0.522mg
0%
Omega-3 - EPA
0g
0.001g
N/A
Omega-3 - ALA
0.085g
N/A
Omega-6 - Eicosadienoic acid
0.001g
N/A
Omega-6 - Linoleic acid
0.947g
N/A
Macronutrient Comparison
Macronutrient breakdown side-by-side comparison
4
18%
50%
23%
5%
4%
Protein:
17.73 g
Fats:
49.67 g
Carbs:
23.45 g
Water:
4.69 g
Other:
4.46 g
1
5%
31%
61%
2%
Protein:
4.88 g
Fats:
31.28 g
Carbs:
61.17 g
Water:
0.97 g
Other:
1.7 g
Contains
more
Protein Protein
+263.3%
Contains
more
Fats Fats
+58.8%
Contains
more
Water Water
+383.5%
Contains
more
Other Other
+162.4%
Contains
more
Carbs Carbs
+160.9%
Fat Type Comparison
Fat type breakdown side-by-side comparison
3
15%
40%
46%
Saturated fat:
Sat. Fat
6.957 g
Monounsaturated fat:
Mono. Fat
18.759 g
Polyunsaturated fat:
Poly. Fat
21.773 g
0
64%
33%
4%
Saturated fat:
Sat. Fat
18.519 g
Monounsaturated fat:
Mono. Fat
9.54 g
Polyunsaturated fat:
Poly. Fat
1.092 g
Contains
less
Sat. Fat Saturated fat
-62.4%
Contains
more
Mono. Fat Monounsaturated fat
+96.6%
Contains
more
Poly. Fat Polyunsaturated fat
+1893.9%