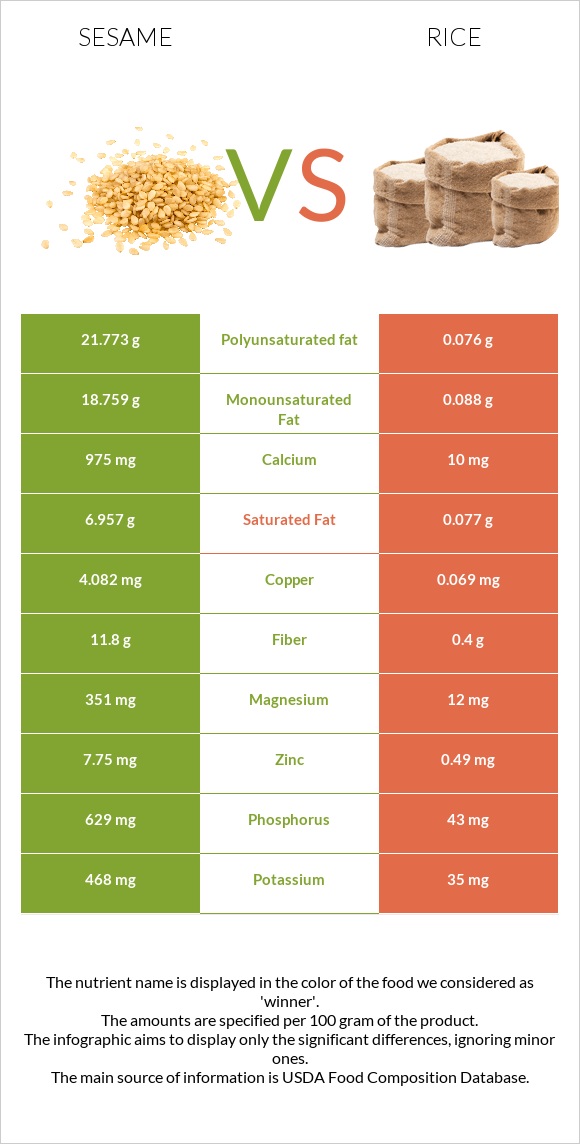
How are sesame and rice different? Sesame is higher than rice in copper, iron, calcium, manganese, phosphorus, magnesium, zinc, vitamin B6, vitamin B1, and selenium. Sesame covers your daily need for copper, 446% more than rice. Sesame contains 98 times more calcium than rice. Sesame contains 975mg of calcium, while rice contains 10mg. Seeds, sesame seeds, whole, dried and Rice, white, long-grain, regular, enriched, cooked types were used in this article.
Infographic
Mineral Comparison
Mineral comparison score is based on the number of minerals by which one or the other food is richer. The "coverage" charts below show how much of the daily needs can be covered by 300 grams of the food.
9
100 g
300 g
1 tbsp - 9g 1 cup - 144g
Magnesium
Magnesium
Calcium
Calcium
Potassium
Potassium
Iron
Iron
Copper
Copper
Zinc
Zinc
Phosphorus
Phosphorus
Sodium
Sodium
Manganese
Manganese
Selenium
Selenium
251%
293%
41%
546%
1361%
211%
270%
1.4%
321%
188%
1
100 g
300 g
1 cup - 158g
Magnesium
Magnesium
Calcium
Calcium
Potassium
Potassium
Iron
Iron
Copper
Copper
Zinc
Zinc
Phosphorus
Phosphorus
Sodium
Sodium
Manganese
Manganese
Selenium
Selenium
8.6%
3%
3.1%
45%
23%
13%
18%
0.13%
62%
41%
Vitamin Comparison
Vitamin comparison score is based on the number of vitamins by which one or the other food is richer. The "coverage" charts below show how much of the daily needs can be covered by 300 grams of the food.
6
100 g
300 g
1 tbsp - 9g 1 cup - 144g
Vitamin C
Vit. C
Vitamin D
Vit. D
Vitamin A
Vit. A
Vitamin E
Vit. E
Vitamin B1
Vit. B1
Vitamin B2
Vit. B2
Vitamin B3
Vit. B3
Vitamin B5
Vit. B5
Vitamin B6
Vit. B6
Vitamin B12
Vit. B12
Vitamin K
Vit. K
Folate
Folate
0%
0%
0%
5%
198%
57%
85%
3%
182%
0%
0%
73%
1
100 g
300 g
1 cup - 158g
Vitamin C
Vit. C
Vitamin D
Vit. D
Vitamin A
Vit. A
Vitamin E
Vit. E
Vitamin B1
Vit. B1
Vitamin B2
Vit. B2
Vitamin B3
Vit. B3
Vitamin B5
Vit. B5
Vitamin B6
Vit. B6
Vitamin B12
Vit. B12
Vitamin K
Vit. K
Folate
Folate
0%
0%
0%
0.8%
41%
3%
28%
23%
21%
0%
0%
44%
All nutrients comparison - raw data values
Nutrient
DV% diff.
Copper
4.082mg
0.069mg
446%
Iron
14.55mg
1.2mg
167%
Polyunsaturated fat
21.773g
0.076g
145%
Calcium
975mg
10mg
97%
Manganese
2.46mg
0.472mg
86%
Phosphorus
629mg
43mg
84%
Magnesium
351mg
12mg
81%
Fats
49.67g
0.28g
76%
Zinc
7.75mg
0.49mg
66%
Vitamin B6
0.79mg
0.093mg
54%
Vitamin B1
0.791mg
0.163mg
52%
Selenium
34.4µg
7.5µg
49%
Monounsaturated fat
18.759g
0.088g
47%
Fiber
11.8g
0.4g
46%
Saturated fat
6.957g
0.077g
31%
Protein
17.73g
2.69g
30%
Calories
573kcal
130kcal
22%
Vitamin B3
4.515mg
1.476mg
19%
Vitamin B2
0.247mg
0.013mg
18%
Potassium
468mg
35mg
13%
Folate
97µg
58µg
10%
Vitamin B5
0.05mg
0.39mg
7%
Choline
25.6mg
2.1mg
4%
Carbs
23.45g
28.17g
2%
Vitamin E
0.25mg
0.04mg
1%
Protein per 100 calories
3.1g
2.1g
N/A
Calories per 10 g protein
323kcal
483kcal
N/A
Weight per 100 calories
17g
77g
N/A
Unsaturated / Saturated Fat ratio
5.8
2.1
N/A
Net carbs
11.65g
27.77g
N/A
Sugar
0.3g
0.05g
N/A
Sodium
11mg
1mg
0%
Tryptophan
0.388mg
0.031mg
0%
Threonine
0.736mg
0.096mg
0%
Isoleucine
0.763mg
0.116mg
0%
Leucine
1.358mg
0.222mg
0%
Lysine
0.569mg
0.097mg
0%
Methionine
0.586mg
0.063mg
0%
Phenylalanine
0.94mg
0.144mg
0%
Valine
0.99mg
0.164mg
0%
Histidine
0.522mg
0.063mg
0%
Macronutrient Comparison
Macronutrient breakdown side-by-side comparison
3
18%
50%
23%
5%
4%
Protein:
17.73 g
Fats:
49.67 g
Carbs:
23.45 g
Water:
4.69 g
Other:
4.46 g
2
3%
28%
68%
Protein:
2.69 g
Fats:
0.28 g
Carbs:
28.17 g
Water:
68.44 g
Other:
0.42 g
Contains
more
Protein Protein
+559.1%
Contains
more
Fats Fats
+17639.3%
Contains
more
Other Other
+961.9%
Contains
more
Carbs Carbs
+20.1%
Contains
more
Water Water
+1359.3%
Fat Type Comparison
Fat type breakdown side-by-side comparison
2
15%
40%
46%
Saturated fat:
Sat. Fat
6.957 g
Monounsaturated fat:
Mono. Fat
18.759 g
Polyunsaturated fat:
Poly. Fat
21.773 g
1
32%
37%
32%
Saturated fat:
Sat. Fat
0.077 g
Monounsaturated fat:
Mono. Fat
0.088 g
Polyunsaturated fat:
Poly. Fat
0.076 g
Contains
more
Mono. Fat Monounsaturated fat
+21217%
Contains
more
Poly. Fat Polyunsaturated fat
+28548.7%
Contains
less
Sat. Fat Saturated fat
-98.9%