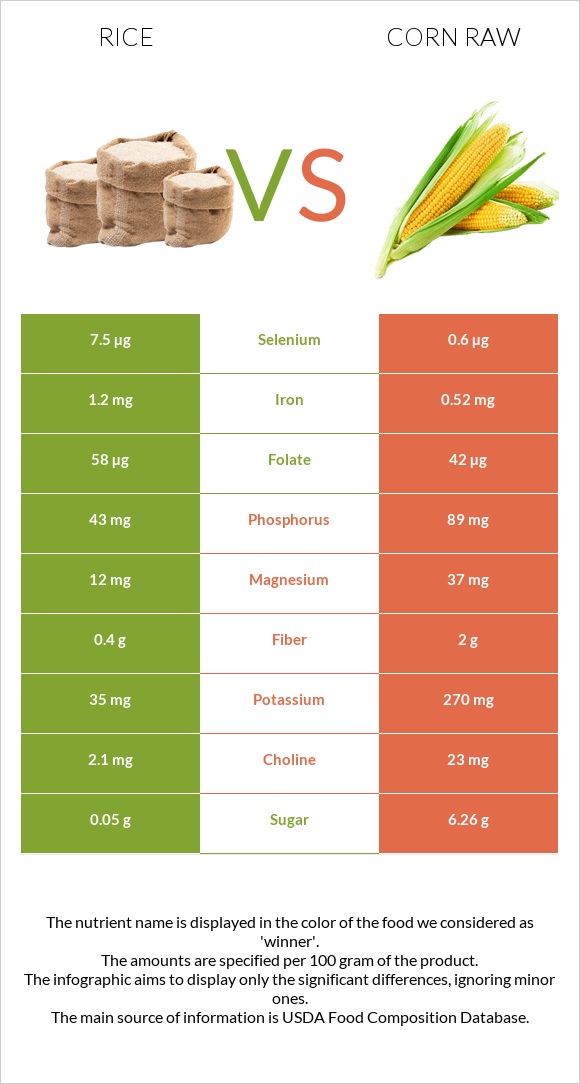
Important differences between rice and corn raw Rice has more manganese, selenium, and iron; however, corn raw has more vitamin C, potassium, phosphorus, vitamin B5, fiber, and magnesium. Rice's daily need coverage for manganese is 13% more. Rice has 13 times more selenium than corn raw. Rice has 7.5µg of selenium, while corn raw has 0.6µg. The food varieties used in the comparison are Rice, white, long-grain, regular, enriched, cooked and Corn, sweet, yellow, raw .
Infographic
Mineral Comparison
Mineral comparison score is based on the number of minerals by which one or the other food is richer. The "coverage" charts below show how much of the daily needs can be covered by 300 grams of the food.
6
100 g
300 g
1 cup - 158g
Magnesium
Magnesium
Calcium
Calcium
Potassium
Potassium
Iron
Iron
Copper
Copper
Zinc
Zinc
Phosphorus
Phosphorus
Sodium
Sodium
Manganese
Manganese
Selenium
Selenium
8.6%
3%
3.1%
45%
23%
13%
18%
0.13%
62%
41%
3
100 g
300 g
1 ear, small (5-1/2" to 6-1/2" long) - 73g 1 ear, medium (6-3/4" to 7-1/2" long) yields - 102g 1 ear, large (7-3/4" to 9" long) yields - 143g 1 cup - 145g
Magnesium
Magnesium
Calcium
Calcium
Potassium
Potassium
Iron
Iron
Copper
Copper
Zinc
Zinc
Phosphorus
Phosphorus
Sodium
Sodium
Manganese
Manganese
Selenium
Selenium
26%
0.6%
24%
20%
18%
13%
38%
2%
21%
3.3%
Vitamin Comparison
Vitamin comparison score is based on the number of vitamins by which one or the other food is richer. The "coverage" charts below show how much of the daily needs can be covered by 300 grams of the food.
1
100 g
300 g
1 cup - 158g
Vitamin C
Vit. C
Vitamin D
Vit. D
Vitamin A
Vit. A
Vitamin E
Vit. E
Vitamin B1
Vit. B1
Vitamin B2
Vit. B2
Vitamin B3
Vit. B3
Vitamin B5
Vit. B5
Vitamin B6
Vit. B6
Vitamin B12
Vit. B12
Vitamin K
Vit. K
Folate
Folate
0%
0%
0%
0.8%
41%
3%
28%
23%
21%
0%
0%
44%
7
100 g
300 g
1 ear, small (5-1/2" to 6-1/2" long) - 73g 1 ear, medium (6-3/4" to 7-1/2" long) yields - 102g 1 ear, large (7-3/4" to 9" long) yields - 143g 1 cup - 145g
Vitamin C
Vit. C
Vitamin D
Vit. D
Vitamin A
Vit. A
Vitamin E
Vit. E
Vitamin B1
Vit. B1
Vitamin B2
Vit. B2
Vitamin B3
Vit. B3
Vitamin B5
Vit. B5
Vitamin B6
Vit. B6
Vitamin B12
Vit. B12
Vitamin K
Vit. K
Folate
Folate
23%
0%
3%
1.4%
39%
13%
33%
43%
21%
0%
0.75%
32%
All nutrients comparison - raw data values
Nutrient
DV% diff.
Manganese
0.472mg
0.163mg
13%
Selenium
7.5µg
0.6µg
13%
Iron
1.2mg
0.52mg
9%
Vitamin C
0mg
6.8mg
8%
Potassium
35mg
270mg
7%
Phosphorus
43mg
89mg
7%
Vitamin B5
0.39mg
0.717mg
7%
Magnesium
12mg
37mg
6%
Fiber
0.4g
2g
6%
Folate
58µg
42µg
4%
Choline
2.1mg
23mg
4%
Carbs
28.17g
18.7g
3%
Vitamin B2
0.013mg
0.055mg
3%
Polyunsaturated fat
0.076g
0.487g
3%
Calories
130kcal
86kcal
2%
Fats
0.28g
1.35g
2%
Copper
0.069mg
0.054mg
2%
Starch
5.7g
2%
Vitamin B3
1.476mg
1.77mg
2%
Fructose
1.94g
2%
Protein
2.69g
3.27g
1%
Calcium
10mg
2mg
1%
Sodium
1mg
15mg
1%
Vitamin A
0µg
9µg
1%
Vitamin B1
0.163mg
0.155mg
1%
Saturated fat
0.077g
0.325g
1%
Monounsaturated fat
0.088g
0.432g
1%
Protein per 100 calories
2.1g
3.8g
N/A
Calories per 10 g protein
483kcal
263kcal
N/A
Weight per 100 calories
77g
116g
N/A
Net carbs
27.77g
16.7g
N/A
Sugar
0.05g
6.26g
N/A
Zinc
0.49mg
0.46mg
0%
Vitamin E
0.04mg
0.07mg
0%
Vitamin B6
0.093mg
0.093mg
0%
Vitamin K
0µg
0.3µg
0%
Tryptophan
0.031mg
0.023mg
0%
Threonine
0.096mg
0.129mg
0%
Isoleucine
0.116mg
0.129mg
0%
Leucine
0.222mg
0.348mg
0%
Lysine
0.097mg
0.137mg
0%
Methionine
0.063mg
0.067mg
0%
Phenylalanine
0.144mg
0.15mg
0%
Valine
0.164mg
0.185mg
0%
Histidine
0.063mg
0.089mg
0%
Omega-3 - ALA
0.014g
N/A
Omega-6 - Linoleic acid
0.468g
N/A
Macronutrient Comparison
Macronutrient breakdown side-by-side comparison
1
3%
28%
68%
Protein:
2.69 g
Fats:
0.28 g
Carbs:
28.17 g
Water:
68.44 g
Other:
0.42 g
4
3%
19%
76%
Protein:
3.27 g
Fats:
1.35 g
Carbs:
18.7 g
Water:
76.05 g
Other:
0.63 g
Contains
more
Carbs Carbs
+50.6%
Contains
more
Protein Protein
+21.6%
Contains
more
Fats Fats
+382.1%
Contains
more
Water Water
+11.1%
Contains
more
Other Other
+50%
Fat Type Comparison
Fat type breakdown side-by-side comparison
1
32%
37%
32%
Saturated fat:
Sat. Fat
0.077 g
Monounsaturated fat:
Mono. Fat
0.088 g
Polyunsaturated fat:
Poly. Fat
0.076 g
2
26%
35%
39%
Saturated fat:
Sat. Fat
0.325 g
Monounsaturated fat:
Mono. Fat
0.432 g
Polyunsaturated fat:
Poly. Fat
0.487 g
Contains
less
Sat. Fat Saturated fat
-76.3%
Contains
more
Mono. Fat Monounsaturated fat
+390.9%
Contains
more
Poly. Fat Polyunsaturated fat
+540.8%