White rice vs Brown rice - Health benefits and Nutrition Comparison


Summary
Brown rice is richer in fiber, B complex vitamins, manganese, zinc, copper, and phosphorus. brown rice has a lower glycemic index. White rice is richer in folate and iron. Brown rice has some advantages over white rice when it comes to health impacts.
Introduction
Rice is a commonly consumed grain eaten by most of the world's population. There are many varieties of rice, and it is considered the second highest-produced crop, just after corn.
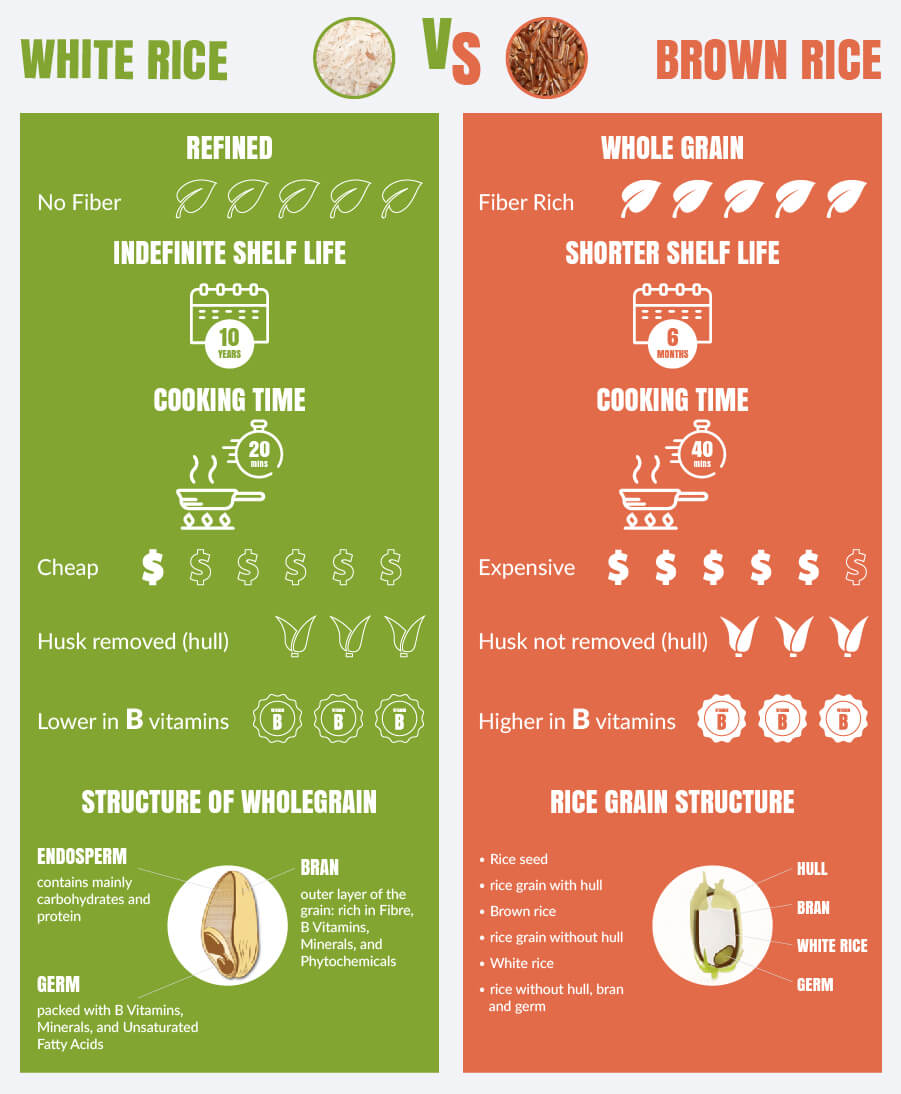
Brown rice is a whole grain consisting of carb-rich endosperm, nutritious germ, and fibrous bran, with only the outer husk removed. In contrast, white rice is a refined, polished grain, with the bran and germ removed, losing by this way most of the vitamins and minerals. It is believed by a number of people that brown rice is better with its nutritional germ and bran, but then again, white rice is mainly artificially enriched with vitamins and minerals to make up for the lack of them.
So which one is better and healthier? In order to find out the answer, let's have a little comparison to reveal the pros and cons of each one.
Nutritional Content
Before passing to the next question, we would like to emphasize that all the comparative information in the charts below is outlined for cooked brown rice and cooked white rice since we consume both of them in this state.
The macronutrient content is nearly similar, except for some minor differences such as white rice being higher in carbs and brown rice being richer in fiber.
Macronutrient Comparison
Contains
more
FatsFats
+246.4%
Vitamins
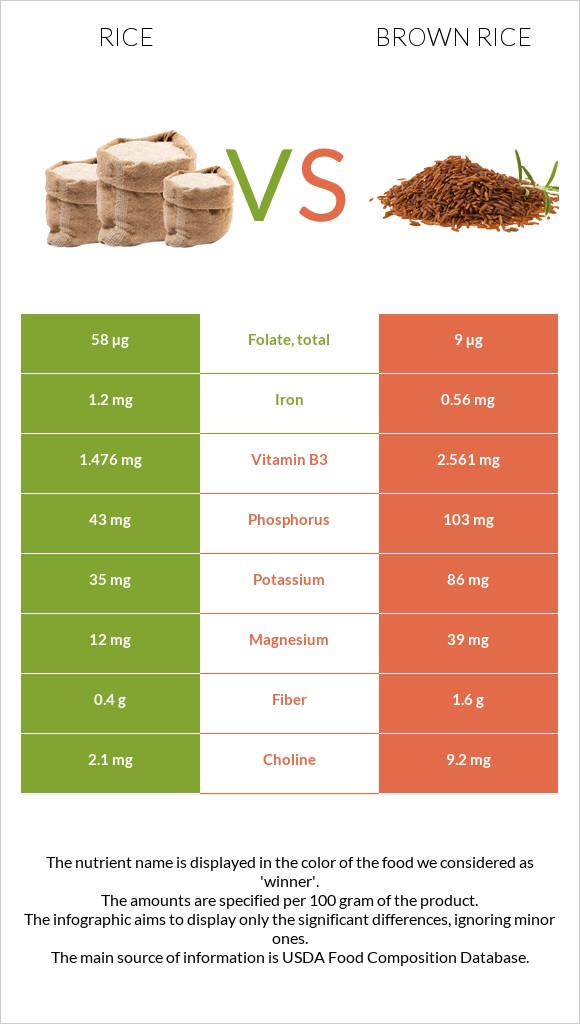
White rice is richer in folate, whereas brown rice is richer in vitamin B1, vitamin B2, vitamin B3, and vitamin B6.
Vitamin Comparison
Contains
more
FolateFolate
+544.4%
Contains
more
Vitamin EVitamin E
+325%
Contains
more
Vitamin B2Vitamin B2
+430.8%
Contains
more
Vitamin B3Vitamin B3
+73.5%
Contains
more
Vitamin B6Vitamin B6
+32.3%
Contains
more
Vitamin KVitamin K
+∞%
Minerals
White rice is richer in iron, whereas brown rice is richer in manganese, copper, zinc, and phosphorus.
Mineral Comparison
Contains
more
CalciumCalcium
+233.3%
Contains
more
IronIron
+114.3%
Contains
less
SodiumSodium
-75%
Contains
more
SeleniumSelenium
+29.3%
Contains
more
MagnesiumMagnesium
+225%
Contains
more
PotassiumPotassium
+145.7%
Contains
more
CopperCopper
+53.6%
Contains
more
ZincZinc
+44.9%
Contains
more
PhosphorusPhosphorus
+139.5%
Contains
more
ManganeseManganese
+106.4%
Health Impact
Health Benefits
Rice is one of the most commonly used carbs in worldwide diets, so it's important to understand its health impacts.
Brown rice has slightly healthier properties compared to white rice in some aspects, such as it being richer in fiber and thus having a lower glycemic index. The cumulative effect of both these is that brown rice would have a healthier advantage over white rice when it comes to cardiovascular health and metabolic health (1).
According to a study published in 2011, consumption of brown rice in place of white rice may lower the risk of type 2 diabetes. The authors estimated that replacing 50 grams/day intake of white rice with the same amount of brown rice had been associated with a 16% lower risk of type 2 diabetes (2).
Brown rice contains numerous bioactive compounds that have anti-lipidemic, anti-hypertensive, and they positively affect the cardiovascular system. In addition, these bioactive compounds have been shown to reduce the risks of Alzheimer's. It's a great option to switch white rice with brown rice (3). These compounds are ferulic acid and γ-oryzanol.
Risks
Brown rice is branded as it contains phytates and phytic acids however, when stored and cooked, these phytic acids are denaturized, and you shouldn't worry about them. (4, 5).
Arsenic can be an issue with rice because it has the potential to accumulate arsenic 10 folds compared to other grains. However, proper agriculture is important.
Storing and Preparation Time
White rice may have indefinite shelf life due to its specific processing, when it loses bran, containing a huge amount of oils. Brown rice, by contrast, has a shorter shelf life. Due to the higher oil content contained in bran, brown rice quickly goes rancid after about 6 months. But don't be upset, there are some options that will help you store brown rice for a longer period.
From the very start, it is necessary to point out that both brown and white rice should be stored in clean, dry, airtight containers. These points are critical because rice quickly absorbs dirt, humidity, and oxygen, which spoil rice. In these containers, you can store white rice for up to 30 years in a cool, dry place with oxygen absorbers in the container. To prolong the shelf life of brown rice, you may store it in the refrigerator for up to 6-12 months and up to 12-18 months in the freezer.
Preparation times of white and brown rice are different again. The cooking time of white rice is about 20 minutes, whereas brown rice's cooking time is about 40 minutes. In this part, white rice is evidently the winner with longer shelf life and shorter preparation time.

Infographic

All nutrients comparison - raw data values
| Nutrient |  |
 |
DV% diff. |
| Manganese | 0.472mg | 0.974mg | 22% |
| Folate | 58µg | 9µg | 12% |
| Starch | 24.79g | 10% | |
| Phosphorus | 43mg | 103mg | 9% |
| Iron | 1.2mg | 0.56mg | 8% |
| Vitamin B3 | 1.476mg | 2.561mg | 7% |
| Magnesium | 12mg | 39mg | 6% |
| Fiber | 0.4g | 1.6g | 5% |
| Copper | 0.069mg | 0.106mg | 4% |
| Vitamin B2 | 0.013mg | 0.069mg | 4% |
| Selenium | 7.5µg | 5.8µg | 3% |
| Potassium | 35mg | 86mg | 2% |
| Zinc | 0.49mg | 0.71mg | 2% |
| Vitamin B6 | 0.093mg | 0.123mg | 2% |
| Polyunsaturated fat | 0.076g | 0.366g | 2% |
| Fats | 0.28g | 0.97g | 1% |
| Carbs | 28.17g | 25.58g | 1% |
| Calcium | 10mg | 3mg | 1% |
| Vitamin E | 0.04mg | 0.17mg | 1% |
| Vitamin B1 | 0.163mg | 0.178mg | 1% |
| Choline | 2.1mg | 9.2mg | 1% |
| Saturated fat | 0.077g | 0.26g | 1% |
| Monounsaturated fat | 0.088g | 0.369g | 1% |
| Calories | 130kcal | 123kcal | 0% |
| Protein | 2.69g | 2.74g | 0% |
| Net carbs | 27.77g | 23.98g | N/A |
| Sugar | 0.05g | 0.24g | N/A |
| Sodium | 1mg | 4mg | 0% |
| Vitamin B5 | 0.39mg | 0.38mg | 0% |
| Vitamin K | 0µg | 0.2µg | 0% |
| Tryptophan | 0.031mg | 0.033mg | 0% |
| Threonine | 0.096mg | 0.095mg | 0% |
| Isoleucine | 0.116mg | 0.109mg | 0% |
| Leucine | 0.222mg | 0.214mg | 0% |
| Lysine | 0.097mg | 0.099mg | 0% |
| Methionine | 0.063mg | 0.058mg | 0% |
| Phenylalanine | 0.144mg | 0.133mg | 0% |
| Valine | 0.164mg | 0.151mg | 0% |
| Histidine | 0.063mg | 0.066mg | 0% |
| Omega-3 - ALA | 0.011g | N/A | |
| Omega-6 - Linoleic acid | 0.355g | N/A |
Fat Type Comparison
| Contains less Sat. FatSaturated fat | -70.4% |
| Contains more Mono. FatMonounsaturated fat | +319.3% |
| Contains more Poly. FatPolyunsaturated fat | +381.6% |
People also compare
References
All the values for which the sources are not specified explicitly are taken from FDA’s Food Central. The exact link to the food presented on this page can be found below.
- Rice - https://fdc.nal.usda.gov/fdc-app.html#/food-details/168878/nutrients
- Brown rice - https://fdc.nal.usda.gov/fdc-app.html#/food-details/169704/nutrients
All the Daily Values are presented for males aged 31-50, for 2000-calorie diets.


