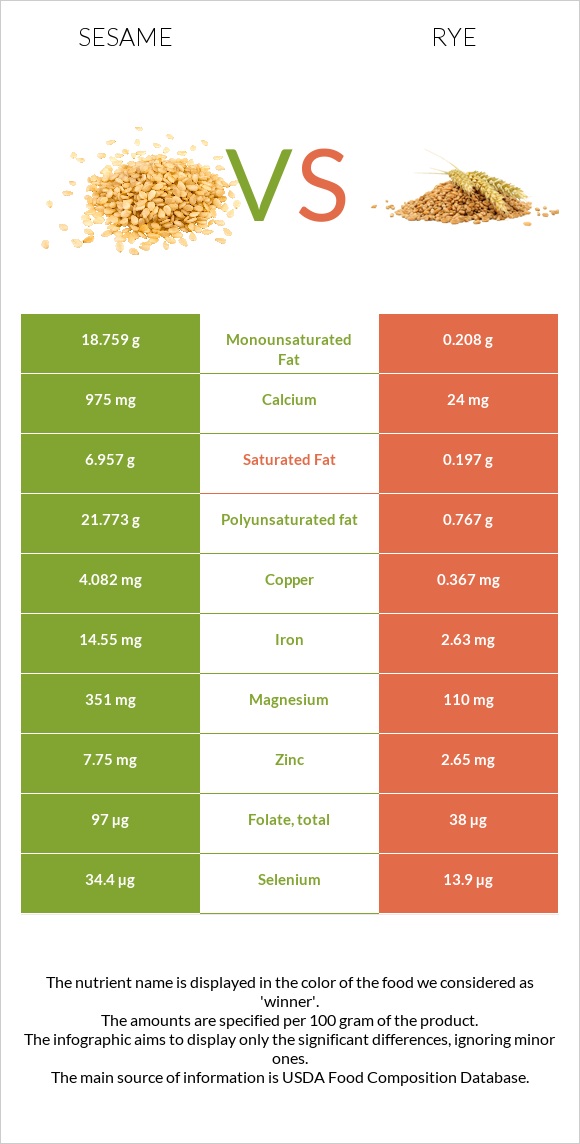
A recap on the differences between sesame and rye Rye has less copper, iron, calcium, magnesium, zinc, phosphorus, vitamin B1, vitamin B6, and selenium. Sesame covers your daily copper needs 413% more than rye. Rye contains 41 times less calcium than sesame. Sesame contains 975mg of calcium, while rye contains 24mg. Rye has less saturated fat. Food varieties used in this article are Seeds, sesame seeds, whole, dried and Rye grain .
Infographic
Mineral Comparison
Mineral comparison score is based on the number of minerals by which one or the other food is richer. The "coverage" charts below show how much of the daily needs can be covered by 300 grams of the food.
7
100 g
300 g
1 tbsp - 9g 1 cup - 144g
Magnesium
Magnesium
Calcium
Calcium
Potassium
Potassium
Iron
Iron
Copper
Copper
Zinc
Zinc
Phosphorus
Phosphorus
Sodium
Sodium
Manganese
Manganese
Selenium
Selenium
251%
293%
41%
546%
1361%
211%
270%
1.4%
321%
188%
1
100 g
300 g
1 cup - 169g
Magnesium
Magnesium
Calcium
Calcium
Potassium
Potassium
Iron
Iron
Copper
Copper
Zinc
Zinc
Phosphorus
Phosphorus
Sodium
Sodium
Manganese
Manganese
Selenium
Selenium
79%
7.2%
45%
99%
122%
72%
142%
0.26%
336%
76%
Vitamin Comparison
Vitamin comparison score is based on the number of vitamins by which one or the other food is richer. The "coverage" charts below show how much of the daily needs can be covered by 300 grams of the food.
3
100 g
300 g
1 tbsp - 9g 1 cup - 144g
Vitamin C
Vit. C
Vitamin D
Vit. D
Vitamin A
Vit. A
Vitamin E
Vit. E
Vitamin B1
Vit. B1
Vitamin B2
Vit. B2
Vitamin B3
Vit. B3
Vitamin B5
Vit. B5
Vitamin B6
Vit. B6
Vitamin B12
Vit. B12
Vitamin K
Vit. K
Folate
Folate
0%
0%
0%
5%
198%
57%
85%
3%
182%
0%
0%
73%
4
100 g
300 g
1 cup - 169g
Vitamin C
Vit. C
Vitamin D
Vit. D
Vitamin A
Vit. A
Vitamin E
Vit. E
Vitamin B1
Vit. B1
Vitamin B2
Vit. B2
Vitamin B3
Vit. B3
Vitamin B5
Vit. B5
Vitamin B6
Vit. B6
Vitamin B12
Vit. B12
Vitamin K
Vit. K
Folate
Folate
0%
0%
0.33%
17%
79%
58%
80%
87%
68%
0%
15%
29%
All nutrients comparison - raw data values
Nutrient
DV% diff.
Copper
4.082mg
0.367mg
413%
Iron
14.55mg
2.63mg
149%
Polyunsaturated fat
21.773g
0.767g
140%
Calcium
975mg
24mg
95%
Fats
49.67g
1.63g
74%
Magnesium
351mg
110mg
57%
Zinc
7.75mg
2.65mg
46%
Monounsaturated fat
18.759g
0.208g
46%
Phosphorus
629mg
332mg
42%
Vitamin B1
0.791mg
0.316mg
40%
Vitamin B6
0.79mg
0.294mg
38%
Selenium
34.4µg
13.9µg
37%
Saturated fat
6.957g
0.197g
31%
Vitamin B5
0.05mg
1.456mg
28%
Carbs
23.45g
75.86g
17%
Protein
17.73g
10.34g
15%
Folate
97µg
38µg
15%
Fiber
11.8g
15.1g
13%
Calories
573kcal
338kcal
12%
Manganese
2.46mg
2.577mg
5%
Vitamin K
0µg
5.9µg
5%
Vitamin E
0.25mg
0.85mg
4%
Vitamin B3
4.515mg
4.27mg
2%
Potassium
468mg
510mg
1%
Choline
25.6mg
30.4mg
1%
Protein per 100 calories
3.1g
3.1g
N/A
Calories per 10 g protein
323kcal
327kcal
N/A
Weight per 100 calories
17g
30g
N/A
Unsaturated / Saturated Fat ratio
5.8
4.9
N/A
Net carbs
11.65g
60.76g
N/A
Sugar
0.3g
0.98g
N/A
Sodium
11mg
2mg
0%
Vitamin A
0µg
1µg
0%
Vitamin B2
0.247mg
0.251mg
0%
Tryptophan
0.388mg
0.108mg
0%
Threonine
0.736mg
0.289mg
0%
Isoleucine
0.763mg
0.208mg
0%
Leucine
1.358mg
0.563mg
0%
Lysine
0.569mg
0.286mg
0%
Methionine
0.586mg
0.153mg
0%
Phenylalanine
0.94mg
0.435mg
0%
Valine
0.99mg
0.317mg
0%
Histidine
0.522mg
0.189mg
0%
Fructose
0.11g
0%
Macronutrient Comparison
Macronutrient breakdown side-by-side comparison
3
18%
50%
23%
5%
4%
Protein:
17.73 g
Fats:
49.67 g
Carbs:
23.45 g
Water:
4.69 g
Other:
4.46 g
2
10%
76%
11%
Protein:
10.34 g
Fats:
1.63 g
Carbs:
75.86 g
Water:
10.6 g
Other:
1.57 g
Contains
more
Protein Protein
+71.5%
Contains
more
Fats Fats
+2947.2%
Contains
more
Other Other
+184.1%
Contains
more
Carbs Carbs
+223.5%
Contains
more
Water Water
+126%
Fat Type Comparison
Fat type breakdown side-by-side comparison
2
15%
40%
46%
Saturated fat:
Sat. Fat
6.957 g
Monounsaturated fat:
Mono. Fat
18.759 g
Polyunsaturated fat:
Poly. Fat
21.773 g
1
17%
18%
65%
Saturated fat:
Sat. Fat
0.197 g
Monounsaturated fat:
Mono. Fat
0.208 g
Polyunsaturated fat:
Poly. Fat
0.767 g
Contains
more
Mono. Fat Monounsaturated fat
+8918.8%
Contains
more
Poly. Fat Polyunsaturated fat
+2738.7%
Contains
less
Sat. Fat Saturated fat
-97.2%