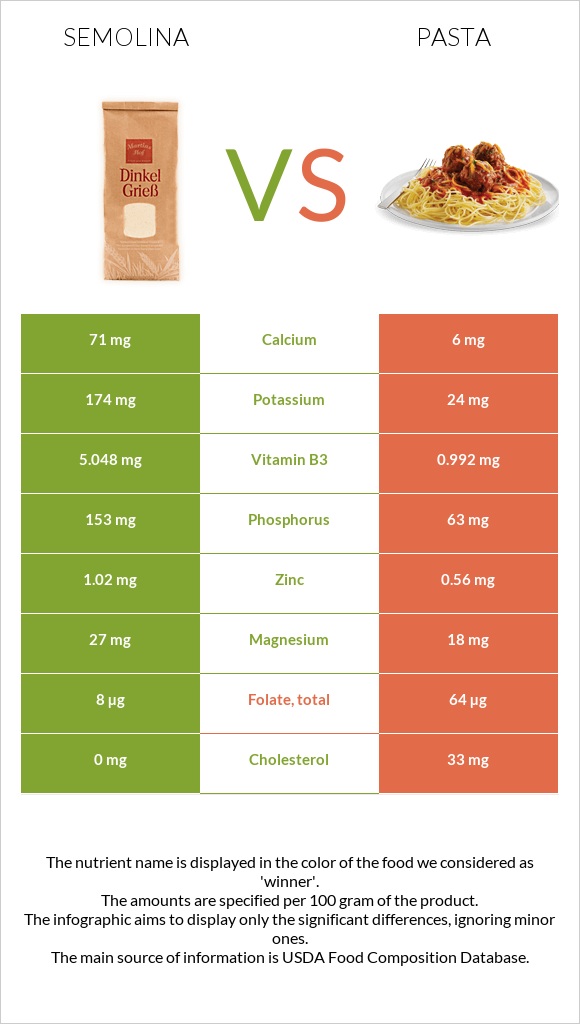
Significant differences between semolina and pasta Semolina has more manganese, vitamin B6, vitamin B3, copper, phosphorus, vitamin B5, and calcium; however, pasta is richer in folate and vitamin B2. Semolina covers your daily manganese needs 35% more than pasta. Pasta has 13 times less vitamin B6 than semolina. Semolina has 0.452mg of vitamin B6, while pasta has 0.034mg. Specific food types used in this comparison are Rice, white, long-grain, parboiled, unenriched, dry and Pasta, fresh-refrigerated, plain, cooked .
Infographic
Mineral Comparison
Mineral comparison score is based on the number of minerals by which one or the other food is richer. The "coverage" charts below show how much of the daily needs can be covered by 300 grams of the food.
9
100 g
300 g
1 cup - 185g
Magnesium
Magnesium
Calcium
Calcium
Potassium
Potassium
Iron
Iron
Copper
Copper
Zinc
Zinc
Phosphorus
Phosphorus
Sodium
Sodium
Manganese
Manganese
Selenium
Selenium
19%
21%
15%
28%
95%
28%
66%
0.26%
135%
109%
1
100 g
300 g
2 oz - 128g
Magnesium
Magnesium
Calcium
Calcium
Potassium
Potassium
Iron
Iron
Copper
Copper
Zinc
Zinc
Phosphorus
Phosphorus
Sodium
Sodium
Manganese
Manganese
Selenium
Selenium
13%
1.8%
2.1%
43%
31%
15%
27%
0.78%
29%
0%
Vitamin Comparison
Vitamin comparison score is based on the number of vitamins by which one or the other food is richer. The "coverage" charts below show how much of the daily needs can be covered by 300 grams of the food.
5
100 g
300 g
1 cup - 185g
Vitamin C
Vit. C
Vitamin D
Vit. D
Vitamin A
Vit. A
Vitamin E
Vit. E
Vitamin B1
Vit. B1
Vitamin B2
Vit. B2
Vitamin B3
Vit. B3
Vitamin B5
Vit. B5
Vitamin B6
Vit. B6
Vitamin B12
Vit. B12
Vitamin K
Vit. K
Folate
Folate
0%
0%
0%
0.6%
56%
12%
95%
40%
104%
0%
0.25%
6%
4
100 g
300 g
2 oz - 128g
Vitamin C
Vit. C
Vitamin D
Vit. D
Vitamin A
Vit. A
Vitamin E
Vit. E
Vitamin B1
Vit. B1
Vitamin B2
Vit. B2
Vitamin B3
Vit. B3
Vitamin B5
Vit. B5
Vitamin B6
Vit. B6
Vitamin B12
Vit. B12
Vitamin K
Vit. K
Folate
Folate
0%
0%
2%
0%
52%
35%
19%
11%
7.8%
18%
0%
48%
All nutrients comparison - raw data values
Nutrient
DV% diff.
Selenium
19.9µg
36%
Manganese
1.035mg
0.224mg
35%
Vitamin B6
0.452mg
0.034mg
32%
Starch
68.29g
28%
Vitamin B3
5.048mg
0.992mg
25%
Copper
0.284mg
0.093mg
21%
Carbs
80.89g
24.93g
19%
Folate
8µg
64µg
14%
Phosphorus
153mg
63mg
13%
Calories
374kcal
131kcal
12%
Cholesterol
0mg
33mg
11%
Vitamin B5
0.672mg
0.183mg
10%
Vitamin B2
0.05mg
0.15mg
8%
Calcium
71mg
6mg
7%
Fiber
1.8g
7%
Vitamin B12
0µg
0.14µg
6%
Protein
7.51g
5.15g
5%
Iron
0.74mg
1.14mg
5%
Potassium
174mg
24mg
4%
Zinc
1.02mg
0.56mg
4%
Magnesium
27mg
18mg
2%
Vitamin A
6µg
1%
Vitamin B1
0.224mg
0.209mg
1%
Saturated fat
0.294g
0.15g
1%
Polyunsaturated fat
0.322g
0.429g
1%
Protein per 100 calories
2g
3.9g
N/A
Calories per 10 g protein
498kcal
254kcal
N/A
Weight per 100 calories
27g
76g
N/A
Fats
1.03g
1.05g
0%
Net carbs
79.09g
24.93g
N/A
Sugar
0.33g
N/A
Sodium
2mg
6mg
0%
Vitamin E
0.03mg
0%
Vitamin K
0.1µg
0%
Monounsaturated fat
0.258g
0.124g
0%
Tryptophan
0.103mg
0.065mg
0%
Threonine
0.271mg
0.134mg
0%
Isoleucine
0.339mg
0.197mg
0%
Leucine
0.656mg
0.348mg
0%
Lysine
0.215mg
0.097mg
0%
Methionine
0.183mg
0.079mg
0%
Phenylalanine
0.398mg
0.247mg
0%
Valine
0.47mg
0.217mg
0%
Histidine
0.185mg
0.103mg
0%
Fructose
0.02g
0%
Macronutrient Comparison
Macronutrient breakdown side-by-side comparison
3
8%
81%
10%
Protein:
7.51 g
Fats:
1.03 g
Carbs:
80.89 g
Water:
9.86 g
Other:
0.71 g
2
5%
25%
69%
Protein:
5.15 g
Fats:
1.05 g
Carbs:
24.93 g
Water:
68.56 g
Other:
0.31 g
Contains
more
Protein Protein
+45.8%
Contains
more
Carbs Carbs
+224.5%
Contains
more
Other Other
+129%
Contains
more
Water Water
+595.3%
Fat Type Comparison
Fat type breakdown side-by-side comparison
1
34%
30%
37%
Saturated fat:
Sat. Fat
0.294 g
Monounsaturated fat:
Mono. Fat
0.258 g
Polyunsaturated fat:
Poly. Fat
0.322 g
2
21%
18%
61%
Saturated fat:
Sat. Fat
0.15 g
Monounsaturated fat:
Mono. Fat
0.124 g
Polyunsaturated fat:
Poly. Fat
0.429 g
Contains
more
Mono. Fat Monounsaturated fat
+108.1%
Contains
less
Sat. Fat Saturated fat
-49%
Contains
more
Poly. Fat Polyunsaturated fat
+33.2%