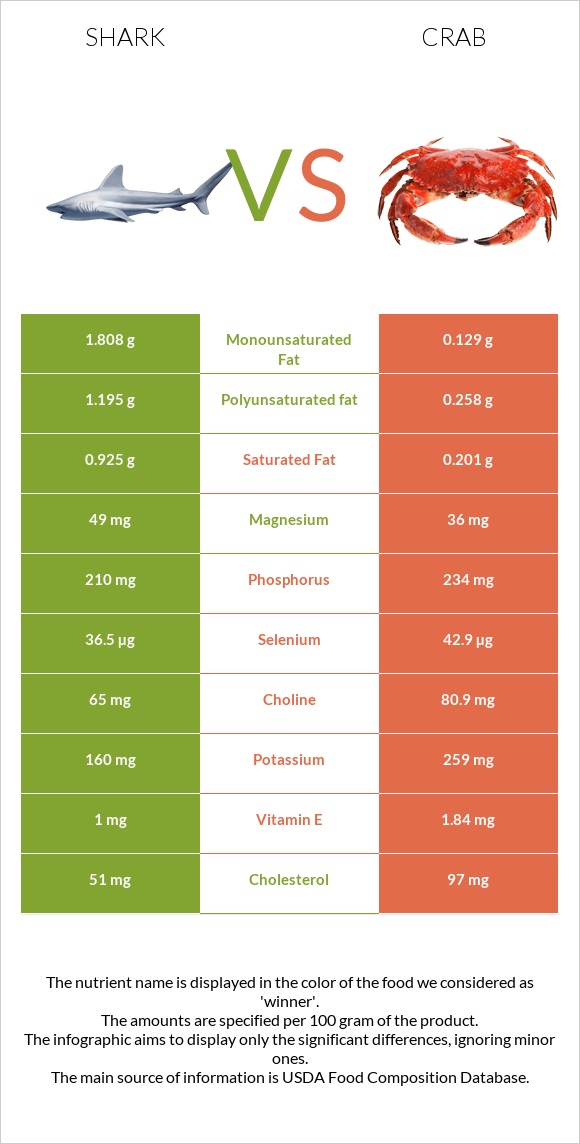
What are the differences between shark and crab? Shark is higher in vitamin B6 and iron, yet crab is higher in vitamin B12, copper, zinc, selenium, and folate. Crab's daily need coverage for vitamin B12 is 88% more. Shark has 16 times more saturated fat than crab. While shark has 3.205g of saturated fat, crab has only 0.201g. We used Fish, shark, mixed species, cooked, batter-dipped and fried and Crustaceans, crab, blue, canned types in this article.
Infographic
Mineral Comparison
Mineral comparison score is based on the number of minerals by which one or the other food is richer. The "coverage" charts below show how much of the daily needs can be covered by 300 grams of the food.
3
100 g
300 g
3 oz - 85g
Magnesium
Magnesium
Calcium
Calcium
Potassium
Potassium
Iron
Iron
Copper
Copper
Zinc
Zinc
Phosphorus
Phosphorus
Sodium
Sodium
Manganese
Manganese
Selenium
Selenium
31%
15%
14%
42%
14%
13%
83%
16%
6.5%
185%
7
100 g
300 g
1 oz - 28.35g 3 oz - 85g 1 can (6.5 oz), drained - 125g 1 cup - 135g
Magnesium
Magnesium
Calcium
Calcium
Potassium
Potassium
Iron
Iron
Copper
Copper
Zinc
Zinc
Phosphorus
Phosphorus
Sodium
Sodium
Manganese
Manganese
Selenium
Selenium
26%
27%
23%
19%
271%
104%
100%
73%
9.7%
234%
Vitamin Comparison
Vitamin comparison score is based on the number of vitamins by which one or the other food is richer. The "coverage" charts below show how much of the daily needs can be covered by 300 grams of the food.
3
100 g
300 g
3 oz - 85g
Vitamin C
Vit. C
Vitamin D
Vit. D
Vitamin A
Vit. A
Vitamin E
Vit. E
Vitamin B1
Vit. B1
Vitamin B2
Vit. B2
Vitamin B3
Vit. B3
Vitamin B5
Vit. B5
Vitamin B6
Vit. B6
Vitamin B12
Vit. B12
Vitamin K
Vit. K
Folate
Folate
0%
0%
18%
0%
18%
22%
52%
37%
69%
151%
0%
11%
6
100 g
300 g
1 oz - 28.35g 3 oz - 85g 1 can (6.5 oz), drained - 125g 1 cup - 135g
Vitamin C
Vit. C
Vitamin D
Vit. D
Vitamin A
Vit. A
Vitamin E
Vit. E
Vitamin B1
Vit. B1
Vitamin B2
Vit. B2
Vitamin B3
Vit. B3
Vitamin B5
Vit. B5
Vitamin B6
Vit. B6
Vitamin B12
Vit. B12
Vitamin K
Vit. K
Folate
Folate
11%
0%
0.33%
37%
5.8%
21%
52%
60%
36%
416%
0.75%
38%
All nutrients comparison - raw data values
Nutrient
DV% diff.
Vitamin B12
1.21µg
3.33µg
88%
Copper
0.042mg
0.814mg
86%
Zinc
0.48mg
3.81mg
30%
Polyunsaturated fat
3.701g
0.258g
23%
Fats
13.82g
0.74g
20%
Sodium
122mg
563mg
19%
Selenium
34µg
42.9µg
16%
Choline
80.9mg
15%
Monounsaturated fat
5.935g
0.129g
15%
Saturated fat
3.205g
0.201g
14%
Cholesterol
59mg
97mg
13%
Vitamin E
1.84mg
12%
Vitamin B6
0.3mg
0.156mg
11%
Folate
15µg
51µg
9%
Iron
1.11mg
0.5mg
8%
Vitamin B5
0.62mg
0.997mg
8%
Calories
228kcal
83kcal
7%
Phosphorus
194mg
234mg
6%
Vitamin A
54µg
1µg
6%
Vitamin C
0mg
3.3mg
4%
Calcium
50mg
91mg
4%
Vitamin B1
0.072mg
0.023mg
4%
Potassium
155mg
259mg
3%
Carbs
6.39g
0g
2%
Magnesium
43mg
36mg
2%
Protein
18.62g
17.88g
1%
Manganese
0.05mg
0.074mg
1%
Protein per 100 calories
8.2g
22g
N/A
Calories per 10 g protein
122kcal
46kcal
N/A
Weight per 100 calories
44g
120g
N/A
Unsaturated / Saturated Fat ratio
3
1.9
N/A
Net carbs
6.39g
0g
N/A
Vitamin B2
0.097mg
0.093mg
0%
Vitamin B3
2.783mg
2.747mg
0%
Vitamin K
0.3µg
0%
Trans fat
0.014g
N/A
Tryptophan
0.212mg
0.226mg
0%
Threonine
0.843mg
0.727mg
0%
Isoleucine
0.867mg
0.776mg
0%
Leucine
1.515mg
1.307mg
0%
Lysine
1.634mg
1.386mg
0%
Methionine
0.541mg
0.452mg
0%
Phenylalanine
0.75mg
0.708mg
0%
Valine
0.965mg
0.806mg
0%
Histidine
0.538mg
0.393mg
0%
Omega-3 - EPA
0.258g
0.101g
N/A
Omega-3 - DHA
0.431g
0.067g
N/A
Omega-3 - DPA
0.089g
0.009g
N/A
Omega-6 - Eicosadienoic acid
0.005g
N/A
Macronutrient Comparison
Macronutrient breakdown side-by-side comparison
3
19%
14%
6%
60%
Protein:
18.62 g
Fats:
13.82 g
Carbs:
6.39 g
Water:
60.09 g
Other:
1.08 g
2
18%
80%
2%
Protein:
17.88 g
Fats:
0.74 g
Carbs:
0 g
Water:
79.69 g
Other:
1.69 g
Contains
more
Fats Fats
+1767.6%
Contains
more
Carbs Carbs
+∞%
Contains
more
Water Water
+32.6%
Contains
more
Other Other
+56.5%
~equal in
Protein
~17.88g
Fat Type Comparison
Fat type breakdown side-by-side comparison
2
25%
46%
29%
Saturated fat:
Sat. Fat
3.205 g
Monounsaturated fat:
Mono. Fat
5.935 g
Polyunsaturated fat:
Poly. Fat
3.701 g
1
34%
22%
44%
Saturated fat:
Sat. Fat
0.201 g
Monounsaturated fat:
Mono. Fat
0.129 g
Polyunsaturated fat:
Poly. Fat
0.258 g
Contains
more
Mono. Fat Monounsaturated fat
+4500.8%
Contains
more
Poly. Fat Polyunsaturated fat
+1334.5%
Contains
less
Sat. Fat Saturated fat
-93.7%