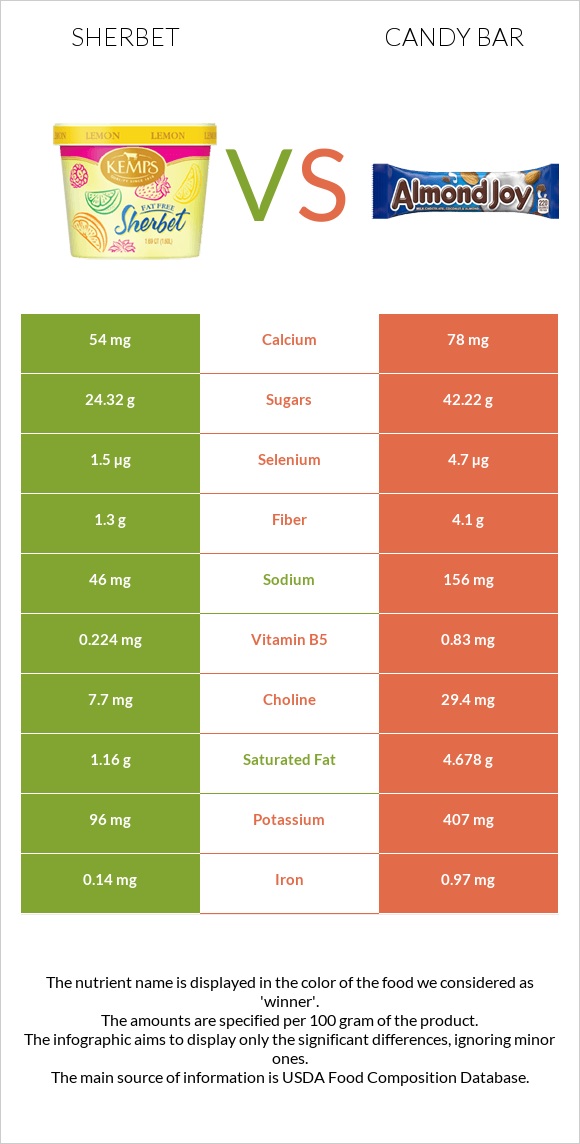
The main differences between sherbet and candy bar Candy bar is richer than sherbet in vitamin B6, copper, manganese, vitamin B3, phosphorus, zinc, vitamin E, magnesium, and folate. Daily need coverage for vitamin B6 for candy bar is 11767% higher. Food types used in this article are Sherbet, orange and Candies, peanut bar .
Infographic
Mineral Comparison
Mineral comparison score is based on the number of minerals by which one or the other food is richer. The "coverage" charts below show how much of the daily needs can be covered by 300 grams of the food.
1
100 g
300 g
1 bar (2.75 fl oz) - 66g 0.5 cup (4 fl oz) - 74g
Magnesium
Magnesium
Calcium
Calcium
Potassium
Potassium
Iron
Iron
Copper
Copper
Zinc
Zinc
Phosphorus
Phosphorus
Sodium
Sodium
Manganese
Manganese
Selenium
Selenium
5.7%
16%
8.5%
5.3%
9.3%
13%
17%
6%
1.4%
8.2%
9
100 g
300 g
1 oz - 28.35g 1 bar (1.4 oz) - 40g 1 bar (1.6 oz) - 45g 1 bar (1.75 fl oz) - 50g
Magnesium
Magnesium
Calcium
Calcium
Potassium
Potassium
Iron
Iron
Copper
Copper
Zinc
Zinc
Phosphorus
Phosphorus
Sodium
Sodium
Manganese
Manganese
Selenium
Selenium
79%
23%
36%
36%
258%
107%
132%
20%
162%
26%
Vitamin Comparison
Vitamin comparison score is based on the number of vitamins by which one or the other food is richer. The "coverage" charts below show how much of the daily needs can be covered by 300 grams of the food.
3
100 g
300 g
1 bar (2.75 fl oz) - 66g 0.5 cup (4 fl oz) - 74g
Vitamin C
Vit. C
Vitamin D
Vit. D
Vitamin A
Vit. A
Vitamin E
Vit. E
Vitamin B1
Vit. B1
Vitamin B2
Vit. B2
Vitamin B3
Vit. B3
Vitamin B5
Vit. B5
Vitamin B6
Vit. B6
Vitamin B12
Vit. B12
Vitamin K
Vit. K
Folate
Folate
7.7%
0%
4%
0.2%
6.8%
22%
1.2%
13%
5.3%
16%
0%
3%
7
100 g
300 g
1 oz - 28.35g 1 bar (1.4 oz) - 40g 1 bar (1.6 oz) - 45g 1 bar (1.75 fl oz) - 50g
Vitamin C
Vit. C
Vitamin D
Vit. D
Vitamin A
Vit. A
Vitamin E
Vit. E
Vitamin B1
Vit. B1
Vitamin B2
Vit. B2
Vitamin B3
Vit. B3
Vitamin B5
Vit. B5
Vitamin B6
Vit. B6
Vitamin B12
Vit. B12
Vitamin K
Vit. K
Folate
Folate
0%
0%
0%
82%
25%
32%
149%
50%
35308%
0%
0%
56%
All nutrients comparison - raw data values
Nutrient
DV% diff.
Vitamin B6
0.023mg
153mg
11767%
Copper
0.028mg
0.774mg
83%
Polyunsaturated fat
0.08g
10.65g
70%
Manganese
0.011mg
1.243mg
54%
Fats
2g
33.7g
49%
Vitamin B3
0.063mg
7.922mg
49%
Monounsaturated fat
0.53g
16.721g
40%
Phosphorus
40mg
308mg
38%
Zinc
0.48mg
3.94mg
31%
Protein
1.1g
15.5g
29%
Vitamin E
0.01mg
4.1mg
27%
Magnesium
8mg
110mg
24%
Calories
144kcal
522kcal
19%
Folate
4µg
75µg
18%
Saturated fat
1.16g
4.678g
16%
Vitamin B5
0.224mg
0.83mg
12%
Fiber
1.3g
4.1g
11%
Iron
0.14mg
0.97mg
10%
Potassium
96mg
407mg
9%
Carbs
30.4g
47.4g
6%
Selenium
1.5µg
4.7µg
6%
Vitamin B1
0.027mg
0.1mg
6%
Sodium
46mg
156mg
5%
Vitamin B12
0.13µg
0µg
5%
Choline
7.7mg
29.4mg
4%
Vitamin C
2.3mg
0mg
3%
Vitamin B2
0.097mg
0.14mg
3%
Calcium
54mg
78mg
2%
Vitamin A
12µg
0µg
1%
Protein per 100 calories
0.76g
3g
N/A
Calories per 10 g protein
1309kcal
337kcal
N/A
Weight per 100 calories
69g
19g
N/A
Unsaturated / Saturated Fat ratio
0.53
5.9
N/A
Net carbs
29.1g
43.3g
N/A
Cholesterol
1mg
0mg
0%
Sugar
24.32g
42.22g
N/A
Tryptophan
0.149mg
0%
Threonine
0.52mg
0%
Isoleucine
0.534mg
0%
Leucine
0.986mg
0%
Lysine
0.545mg
0%
Methionine
0.185mg
0%
Phenylalanine
0.787mg
0%
Valine
0.638mg
0%
Histidine
0.385mg
0%
Macronutrient Comparison
Macronutrient breakdown side-by-side comparison
1
2%
30%
66%
Protein:
1.1 g
Fats:
2 g
Carbs:
30.4 g
Water:
66.1 g
Other:
0.4 g
4
16%
34%
47%
2%
Protein:
15.5 g
Fats:
33.7 g
Carbs:
47.4 g
Water:
1.6 g
Other:
1.8 g
Contains
more
Water Water
+4031.3%
Contains
more
Protein Protein
+1309.1%
Contains
more
Fats Fats
+1585%
Contains
more
Carbs Carbs
+55.9%
Contains
more
Other Other
+350%
Fat Type Comparison
Fat type breakdown side-by-side comparison
1
66%
30%
5%
Saturated fat:
Sat. Fat
1.16 g
Monounsaturated fat:
Mono. Fat
0.53 g
Polyunsaturated fat:
Poly. Fat
0.08 g
2
15%
52%
33%
Saturated fat:
Sat. Fat
4.678 g
Monounsaturated fat:
Mono. Fat
16.721 g
Polyunsaturated fat:
Poly. Fat
10.65 g
Contains
less
Sat. Fat Saturated fat
-75.2%
Contains
more
Mono. Fat Monounsaturated fat
+3054.9%
Contains
more
Poly. Fat Polyunsaturated fat
+13212.5%