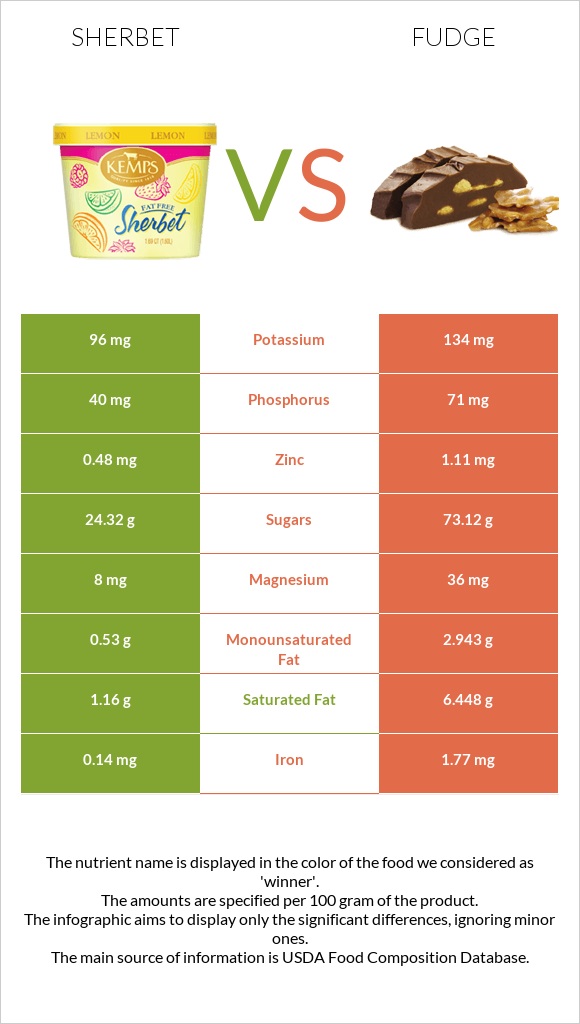
What are the differences between sherbet and fudge? Fudge is richer than sherbet in copper, iron, manganese, magnesium, zinc, and monounsaturated fat. Fudge's daily need coverage for copper is 33% more. The amount of sugar in sherbet is lower. We used Sherbet, orange and Candies, fudge, chocolate, prepared-from-recipe types in this article.
Infographic
Mineral Comparison
Mineral comparison score is based on the number of minerals by which one or the other food is richer. The "coverage" charts below show how much of the daily needs can be covered by 300 grams of the food.
0
100 g
300 g
1 bar (2.75 fl oz) - 66g 0.5 cup (4 fl oz) - 74g
Magnesium
Magnesium
Calcium
Calcium
Potassium
Potassium
Iron
Iron
Copper
Copper
Zinc
Zinc
Phosphorus
Phosphorus
Sodium
Sodium
Manganese
Manganese
Selenium
Selenium
5.7%
16%
8.5%
5.3%
9.3%
13%
17%
6%
1.4%
8.2%
8
100 g
300 g
1 piece - 17g
Magnesium
Magnesium
Calcium
Calcium
Potassium
Potassium
Iron
Iron
Copper
Copper
Zinc
Zinc
Phosphorus
Phosphorus
Sodium
Sodium
Manganese
Manganese
Selenium
Selenium
26%
15%
12%
66%
110%
30%
30%
5.9%
55%
14%
Vitamin Comparison
Vitamin comparison score is based on the number of vitamins by which one or the other food is richer. The "coverage" charts below show how much of the daily needs can be covered by 300 grams of the food.
5
100 g
300 g
1 bar (2.75 fl oz) - 66g 0.5 cup (4 fl oz) - 74g
Vitamin C
Vit. C
Vitamin D
Vit. D
Vitamin A
Vit. A
Vitamin E
Vit. E
Vitamin B1
Vit. B1
Vitamin B2
Vit. B2
Vitamin B3
Vit. B3
Vitamin B5
Vit. B5
Vitamin B6
Vit. B6
Vitamin B12
Vit. B12
Vitamin K
Vit. K
Folate
Folate
7.7%
0%
4%
0.2%
6.8%
22%
1.2%
13%
5.3%
16%
0%
3%
4
100 g
300 g
1 piece - 17g
Vitamin C
Vit. C
Vitamin D
Vit. D
Vitamin A
Vit. A
Vitamin E
Vit. E
Vitamin B1
Vit. B1
Vitamin B2
Vit. B2
Vitamin B3
Vit. B3
Vitamin B5
Vit. B5
Vitamin B6
Vit. B6
Vitamin B12
Vit. B12
Vitamin K
Vit. K
Folate
Folate
0%
0%
15%
3.6%
6.5%
20%
3.3%
8.4%
2.8%
11%
3.5%
3%
All nutrients comparison - raw data values
Nutrient
DV% diff.
Copper
0.028mg
0.329mg
33%
Saturated fat
1.16g
6.448g
24%
Iron
0.14mg
1.77mg
20%
Manganese
0.011mg
0.422mg
18%
Carbs
30.4g
76.44g
15%
Calories
144kcal
411kcal
13%
Fats
2g
10.41g
13%
Magnesium
8mg
36mg
7%
Zinc
0.48mg
1.11mg
6%
Monounsaturated fat
0.53g
2.943g
6%
Cholesterol
1mg
14mg
4%
Phosphorus
40mg
71mg
4%
Vitamin A
12µg
44µg
4%
Protein
1.1g
2.39g
3%
Vitamin C
2.3mg
0mg
3%
Fiber
1.3g
1.7g
2%
Selenium
1.5µg
2.5µg
2%
Vitamin B5
0.224mg
0.14mg
2%
Vitamin B12
0.13µg
0.09µg
2%
Polyunsaturated fat
0.08g
0.373g
2%
Caffeine
0mg
8mg
2%
Calcium
54mg
49mg
1%
Potassium
96mg
134mg
1%
Vitamin E
0.01mg
0.18mg
1%
Vitamin B2
0.097mg
0.085mg
1%
Vitamin B3
0.063mg
0.176mg
1%
Vitamin B6
0.023mg
0.012mg
1%
Vitamin K
0µg
1.4µg
1%
Weight per 100 calories
69g
24g
N/A
Unsaturated / Saturated Fat ratio
0.53
0.51
N/A
Net carbs
29.1g
74.74g
N/A
Sugar
24.32g
73.12g
N/A
Sodium
46mg
45mg
0%
Vitamin B1
0.027mg
0.026mg
0%
Folate
4µg
4µg
0%
Trans fat
0.165g
N/A
Choline
7.7mg
10mg
0%
Macronutrient Comparison
Macronutrient breakdown side-by-side comparison
1
2%
30%
66%
Protein:
1.1 g
Fats:
2 g
Carbs:
30.4 g
Water:
66.1 g
Other:
0.4 g
4
2%
10%
76%
10%
Protein:
2.39 g
Fats:
10.41 g
Carbs:
76.44 g
Water:
9.81 g
Other:
0.95 g
Contains
more
Water Water
+573.8%
Contains
more
Protein Protein
+117.3%
Contains
more
Fats Fats
+420.5%
Contains
more
Carbs Carbs
+151.4%
Contains
more
Other Other
+137.5%
Fat Type Comparison
Fat type breakdown side-by-side comparison
1
66%
30%
5%
Saturated fat:
Sat. Fat
1.16 g
Monounsaturated fat:
Mono. Fat
0.53 g
Polyunsaturated fat:
Poly. Fat
0.08 g
2
66%
30%
4%
Saturated fat:
Sat. Fat
6.448 g
Monounsaturated fat:
Mono. Fat
2.943 g
Polyunsaturated fat:
Poly. Fat
0.373 g
Contains
less
Sat. Fat Saturated fat
-82%
Contains
more
Mono. Fat Monounsaturated fat
+455.3%
Contains
more
Poly. Fat Polyunsaturated fat
+366.3%