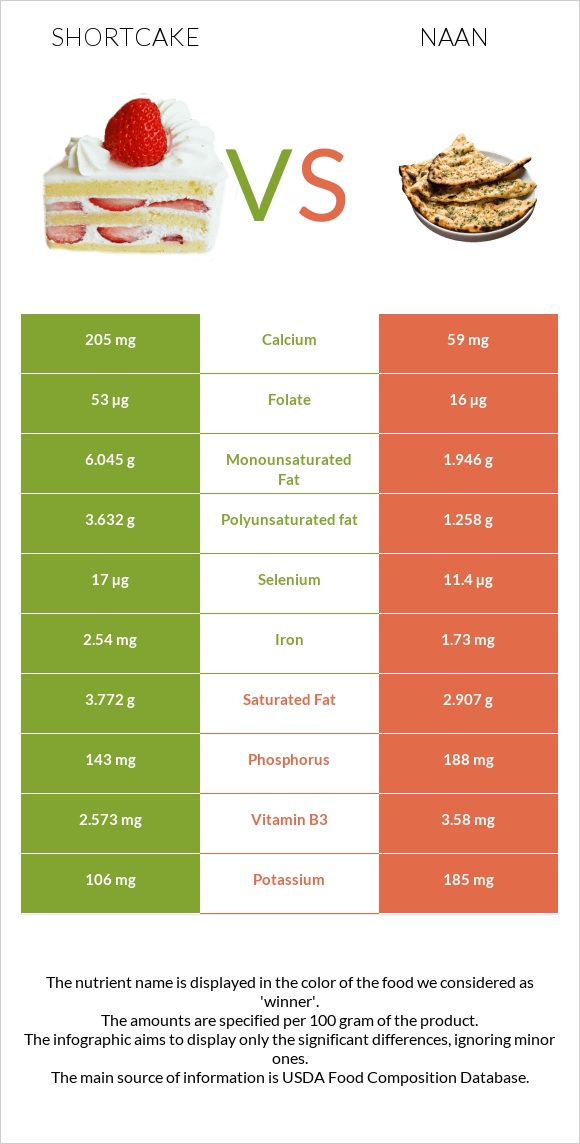
Summary of differences between shortcake and naan Shortcake has more calcium, vitamin B1, selenium, iron, folate, and vitamin B2; however, naan is higher in manganese, magnesium, copper, and vitamin B6. Naan covers your daily need for manganese, 47% more than shortcake. Shortcake has 3 times more calcium than naan. While shortcake has 205mg of calcium, naan has only 59mg. These are the specific foods used in this comparison Cake, shortcake, biscuit-type, prepared from recipe and Bread, naan, whole wheat, commercially prepared, refrigerated .
Infographic
Mineral Comparison
Mineral comparison score is based on the number of minerals by which one or the other food is richer. The "coverage" charts below show how much of the daily needs can be covered by 300 grams of the food.
3
100 g
300 g
1 oz - 28.35g
Magnesium
Magnesium
Calcium
Calcium
Potassium
Potassium
Iron
Iron
Copper
Copper
Zinc
Zinc
Phosphorus
Phosphorus
Sodium
Sodium
Manganese
Manganese
Selenium
Selenium
11%
62%
9.4%
95%
25%
13%
61%
66%
43%
93%
6
100 g
300 g
1 piece - 106g
Magnesium
Magnesium
Calcium
Calcium
Potassium
Potassium
Iron
Iron
Copper
Copper
Zinc
Zinc
Phosphorus
Phosphorus
Sodium
Sodium
Manganese
Manganese
Selenium
Selenium
49%
18%
16%
65%
53%
34%
81%
61%
183%
62%
Vitamin Comparison
Vitamin comparison score is based on the number of vitamins by which one or the other food is richer. The "coverage" charts below show how much of the daily needs can be covered by 300 grams of the food.
7
100 g
300 g
1 oz - 28.35g
Vitamin C
Vit. C
Vitamin D
Vit. D
Vitamin A
Vit. A
Vitamin E
Vit. E
Vitamin B1
Vit. B1
Vitamin B2
Vit. B2
Vitamin B3
Vit. B3
Vitamin B5
Vit. B5
Vitamin B6
Vit. B6
Vitamin B12
Vit. B12
Vitamin K
Vit. K
Folate
Folate
0.67%
0%
6%
0%
78%
63%
48%
15%
6.9%
8.8%
0%
40%
4
100 g
300 g
1 piece - 106g
Vitamin C
Vit. C
Vitamin D
Vit. D
Vitamin A
Vit. A
Vitamin E
Vit. E
Vitamin B1
Vit. B1
Vitamin B2
Vit. B2
Vitamin B3
Vit. B3
Vitamin B5
Vit. B5
Vitamin B6
Vit. B6
Vitamin B12
Vit. B12
Vitamin K
Vit. K
Folate
Folate
0%
0%
0.67%
26%
44%
42%
67%
0%
30%
0%
8.3%
12%
All nutrients comparison - raw data values
Nutrient
DV% diff.
Manganese
0.33mg
1.4mg
47%
Fiber
4.8g
19%
Polyunsaturated fat
3.632g
1.258g
16%
Calcium
205mg
59mg
15%
Starch
36g
15%
Fats
14.2g
6.7g
12%
Magnesium
16mg
68mg
12%
Vitamin B1
0.311mg
0.176mg
11%
Iron
2.54mg
1.73mg
10%
Selenium
17µg
11.4µg
10%
Monounsaturated fat
6.045g
1.946g
10%
Copper
0.076mg
0.158mg
9%
Vitamin E
1.32mg
9%
Folate
53µg
16µg
9%
Protein
6.1g
10.2g
8%
Vitamin B6
0.03mg
0.128mg
8%
Zinc
0.48mg
1.24mg
7%
Vitamin B2
0.272mg
0.18mg
7%
Phosphorus
143mg
188mg
6%
Vitamin B3
2.573mg
3.58mg
6%
Vitamin B5
0.248mg
5%
Saturated fat
3.772g
2.907g
4%
Calories
346kcal
286kcal
3%
Vitamin B12
0.07µg
0µg
3%
Vitamin K
3.3µg
3%
Potassium
106mg
185mg
2%
Sodium
506mg
467mg
2%
Vitamin A
18µg
2µg
2%
Choline
10.1mg
2%
Carbs
48.5g
46.21g
1%
Cholesterol
3mg
1mg
1%
Fructose
0.8g
1%
Protein per 100 calories
1.8g
3.6g
N/A
Calories per 10 g protein
567kcal
280kcal
N/A
Weight per 100 calories
29g
35g
N/A
Unsaturated / Saturated Fat ratio
2.6
1.1
N/A
Vitamin C
0.2mg
0mg
0%
Net carbs
48.5g
41.41g
N/A
Sugar
3.4g
N/A
Tryptophan
0.076mg
0%
Threonine
0.184mg
0%
Isoleucine
0.238mg
0%
Leucine
0.449mg
0%
Lysine
0.197mg
0%
Methionine
0.115mg
0%
Phenylalanine
0.302mg
0%
Valine
0.273mg
0%
Histidine
0.14mg
0%
Macronutrient Comparison
Macronutrient breakdown side-by-side comparison
3
6%
14%
49%
28%
3%
Protein:
6.1 g
Fats:
14.2 g
Carbs:
48.5 g
Water:
28.4 g
Other:
2.8 g
2
10%
7%
46%
35%
2%
Protein:
10.2 g
Fats:
6.7 g
Carbs:
46.21 g
Water:
34.9 g
Other:
1.99 g
Contains
more
Fats Fats
+111.9%
Contains
more
Other Other
+40.7%
Contains
more
Protein Protein
+67.2%
Contains
more
Water Water
+22.9%
Fat Type Comparison
Fat type breakdown side-by-side comparison
2
28%
45%
27%
Saturated fat:
Sat. Fat
3.772 g
Monounsaturated fat:
Mono. Fat
6.045 g
Polyunsaturated fat:
Poly. Fat
3.632 g
1
48%
32%
21%
Saturated fat:
Sat. Fat
2.907 g
Monounsaturated fat:
Mono. Fat
1.946 g
Polyunsaturated fat:
Poly. Fat
1.258 g
Contains
more
Mono. Fat Monounsaturated fat
+210.6%
Contains
more
Poly. Fat Polyunsaturated fat
+188.7%
Contains
less
Sat. Fat Saturated fat
-22.9%