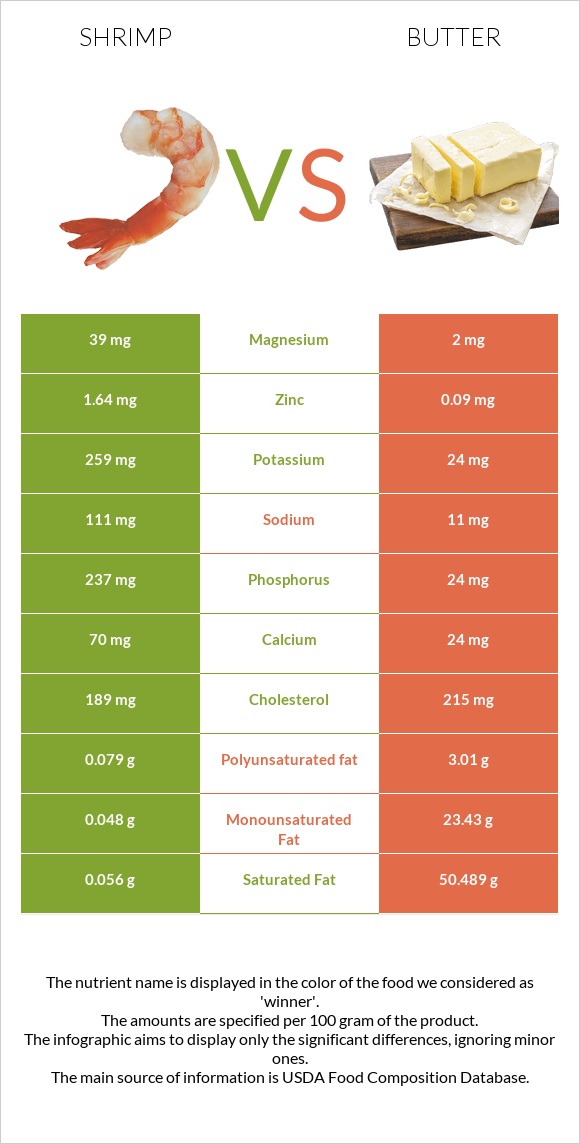
What are the main differences between shrimp and butter? Butter has less copper, phosphorus, zinc, magnesium, potassium, and iron than shrimp. Butter's daily need coverage for saturated fat is 252% higher. Shrimp has 26 times more iron than butter. Shrimp has 0.51mg of iron, while butter has 0.02mg. Butter contains less sodium. Butter has a lower glycemic index than shrimp. We used Crustaceans, shrimp, cooked (not previously frozen) and Butter, without salt types in this comparison.
Infographic
Mineral Comparison
Mineral comparison score is based on the number of minerals by which one or the other food is richer. The "coverage" charts below show how much of the daily needs can be covered by 300 grams of the food.
8
100 g
300 g
3 oz - 85g
Magnesium
Magnesium
Calcium
Calcium
Potassium
Potassium
Iron
Iron
Copper
Copper
Zinc
Zinc
Phosphorus
Phosphorus
Sodium
Sodium
Manganese
Manganese
Selenium
Selenium
28%
21%
23%
19%
126%
45%
102%
14%
4.3%
0%
2
100 g
300 g
1 pat (1" sq, 1/3" high) - 5g 1 tbsp - 14.2g 1 stick - 113g 1 cup - 227g
Magnesium
Magnesium
Calcium
Calcium
Potassium
Potassium
Iron
Iron
Copper
Copper
Zinc
Zinc
Phosphorus
Phosphorus
Sodium
Sodium
Manganese
Manganese
Selenium
Selenium
1.4%
7.2%
2.1%
0.75%
5.3%
2.5%
10%
1.4%
0.52%
5.5%
Vitamin Comparison
Vitamin comparison score is based on the number of vitamins by which one or the other food is richer. The "coverage" charts below show how much of the daily needs can be covered by 300 grams of the food.
0
100 g
300 g
3 oz - 85g
Vitamin C
Vit. C
Vitamin D
Vit. D
Vitamin A
Vit. A
Vitamin E
Vit. E
Vitamin B1
Vit. B1
Vitamin B2
Vit. B2
Vitamin B3
Vit. B3
Vitamin B5
Vit. B5
Vitamin B6
Vit. B6
Vitamin B12
Vit. B12
Vitamin K
Vit. K
Folate
Folate
0%
0%
0%
0%
0%
0%
0%
0%
0%
0%
0%
0%
10
100 g
300 g
1 pat (1" sq, 1/3" high) - 5g 1 tbsp - 14.2g 1 stick - 113g 1 cup - 227g
Vitamin C
Vit. C
Vitamin D
Vit. D
Vitamin A
Vit. A
Vitamin E
Vit. E
Vitamin B1
Vit. B1
Vitamin B2
Vit. B2
Vitamin B3
Vit. B3
Vitamin B5
Vit. B5
Vitamin B6
Vit. B6
Vitamin B12
Vit. B12
Vitamin K
Vit. K
Folate
Folate
0%
0%
228%
46%
1.3%
7.8%
0.79%
6.6%
0.69%
21%
18%
2.3%
All nutrients comparison - raw data values
Nutrient
DV% diff.
Saturated fat
0.056g
50.489g
229%
Fats
0.28g
81.11g
124%
Vitamin A
684µg
76%
Monounsaturated fat
0.048g
23.43g
58%
Protein
23.98g
0.85g
46%
Copper
0.379mg
0.016mg
40%
Calories
99kcal
717kcal
31%
Phosphorus
237mg
24mg
30%
Polyunsaturated fat
0.079g
3.01g
20%
Vitamin E
2.32mg
15%
Zinc
1.64mg
0.09mg
14%
Cholesterol
189mg
215mg
9%
Magnesium
39mg
2mg
9%
Potassium
259mg
24mg
7%
Vitamin B12
0.17µg
7%
Iron
0.51mg
0.02mg
6%
Vitamin K
7µg
6%
Calcium
70mg
24mg
5%
Sodium
111mg
11mg
4%
Vitamin B2
0.034mg
3%
Choline
18.8mg
3%
Selenium
1µg
2%
Vitamin B5
0.11mg
2%
Manganese
0.033mg
0.004mg
1%
Folate
3µg
1%
Protein per 100 calories
24g
0.12g
N/A
Calories per 10 g protein
41kcal
8435kcal
N/A
Weight per 100 calories
101g
14g
N/A
Unsaturated / Saturated Fat ratio
2.3
0.52
N/A
Net carbs
0.2g
0.06g
N/A
Carbs
0.2g
0.06g
0%
Sugar
0.06g
N/A
Vitamin B1
0.005mg
0%
Vitamin B3
0.042mg
0%
Vitamin B6
0.003mg
0%
Trans fat
0.002g
N/A
Tryptophan
0.012mg
0%
Threonine
0.038mg
0%
Isoleucine
0.051mg
0%
Leucine
0.083mg
0%
Lysine
0.067mg
0%
Methionine
0.021mg
0%
Phenylalanine
0.041mg
0%
Valine
0.057mg
0%
Histidine
0.023mg
0%
Omega-3 - EPA
0.015g
0g
N/A
Omega-3 - DHA
0.015g
0g
N/A
Omega-3 - ALA
0.001g
0.315g
N/A
Omega-3 - DPA
0.001g
0g
N/A
Omega-6 - Dihomo-gamma-linoleic acid
0.001g
N/A
Omega-6 - Eicosadienoic acid
0.002g
N/A
Omega-6 - Linoleic acid
0.018g
2.166g
N/A
Macronutrient Comparison
Macronutrient breakdown side-by-side comparison
4
24%
74%
Protein:
23.98 g
Fats:
0.28 g
Carbs:
0.2 g
Water:
74.33 g
Other:
1.21 g
1
81%
18%
Protein:
0.85 g
Fats:
81.11 g
Carbs:
0.06 g
Water:
17.94 g
Other:
0.04 g
Contains
more
Protein Protein
+2721.2%
Contains
more
Carbs Carbs
+233.3%
Contains
more
Water Water
+314.3%
Contains
more
Other Other
+2925%
Contains
more
Fats Fats
+28867.9%
Fat Type Comparison
Fat type breakdown side-by-side comparison
1
31%
26%
43%
Saturated fat:
Sat. Fat
0.056 g
Monounsaturated fat:
Mono. Fat
0.048 g
Polyunsaturated fat:
Poly. Fat
0.079 g
2
66%
30%
4%
Saturated fat:
Sat. Fat
50.489 g
Monounsaturated fat:
Mono. Fat
23.43 g
Polyunsaturated fat:
Poly. Fat
3.01 g
Contains
less
Sat. Fat Saturated fat
-99.9%
Contains
more
Mono. Fat Monounsaturated fat
+48712.5%
Contains
more
Poly. Fat Polyunsaturated fat
+3710.1%