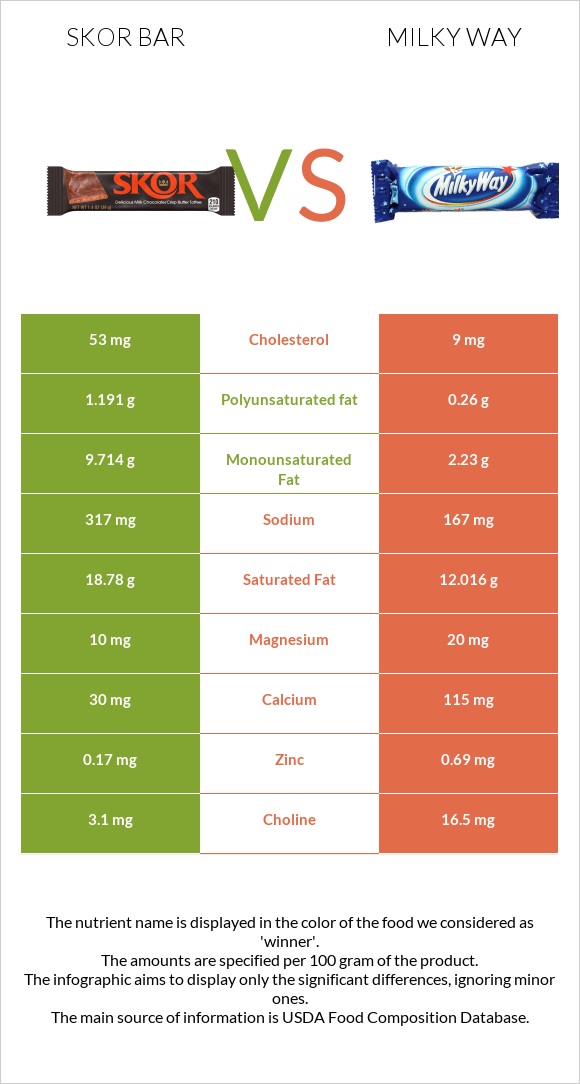
Differences between skor bar and Milky Way Skor bar has more polyunsaturated fat, while Milky Way has more copper, calcium, and manganese. Skor bar's daily need coverage for saturated fat is 34% higher. Milky Way contains 6 times less cholesterol than skor bar. Skor bar contains 53mg of cholesterol, while Milky Way contains 9mg. The food types used in this comparison are Candies, HERSHEY'S SKOR Toffee Bar and Candies, MARS SNACKFOOD US, MILKY WAY Bar .
Infographic
Mineral Comparison
Mineral comparison score is based on the number of minerals by which one or the other food is richer. The "coverage" charts below show how much of the daily needs can be covered by 300 grams of the food.
2
100 g
300 g
1 bar 1.4 oz - 39g
Magnesium
Magnesium
Calcium
Calcium
Potassium
Potassium
Iron
Iron
Copper
Copper
Zinc
Zinc
Phosphorus
Phosphorus
Sodium
Sodium
Manganese
Manganese
Selenium
Selenium
7.1%
9%
14%
21%
13%
4.6%
26%
41%
0%
0%
7
100 g
300 g
1 piece miniature 5 pieces = serving - 8.2g 1 bar fun size - 17g 1 serving 2.05 oz bar - 58g 1 bar king size - 103g
Magnesium
Magnesium
Calcium
Calcium
Potassium
Potassium
Iron
Iron
Copper
Copper
Zinc
Zinc
Phosphorus
Phosphorus
Sodium
Sodium
Manganese
Manganese
Selenium
Selenium
14%
35%
11%
18%
49%
19%
29%
22%
19%
11%
Vitamin Comparison
Vitamin comparison score is based on the number of vitamins by which one or the other food is richer. The "coverage" charts below show how much of the daily needs can be covered by 300 grams of the food.
4
100 g
300 g
1 bar 1.4 oz - 39g
Vitamin C
Vit. C
Vitamin D
Vit. D
Vitamin A
Vit. A
Vitamin E
Vit. E
Vitamin B1
Vit. B1
Vitamin B2
Vit. B2
Vitamin B3
Vit. B3
Vitamin B5
Vit. B5
Vitamin B6
Vit. B6
Vitamin B12
Vit. B12
Vitamin K
Vit. K
Folate
Folate
1.7%
1.5%
20%
12%
5%
23%
2.4%
2.4%
5.1%
26%
22%
1.5%
7
100 g
300 g
1 piece miniature 5 pieces = serving - 8.2g 1 bar fun size - 17g 1 serving 2.05 oz bar - 58g 1 bar king size - 103g
Vitamin C
Vit. C
Vitamin D
Vit. D
Vitamin A
Vit. A
Vitamin E
Vit. E
Vitamin B1
Vit. B1
Vitamin B2
Vit. B2
Vitamin B3
Vit. B3
Vitamin B5
Vit. B5
Vitamin B6
Vit. B6
Vitamin B12
Vit. B12
Vitamin K
Vit. K
Folate
Folate
2.3%
6%
10%
18%
12%
24%
2.9%
9.3%
3.2%
23%
9%
3%
All nutrients comparison - raw data values
Nutrient
DV% diff.
Saturated fat
18.78g
12.016g
31%
Fats
30.37g
17.23g
20%
Monounsaturated fat
9.714g
2.23g
19%
Cholesterol
53mg
9mg
15%
Copper
0.04mg
0.147mg
12%
Calcium
30mg
115mg
9%
Sodium
317mg
167mg
7%
Manganese
0mg
0.147mg
6%
Polyunsaturated fat
1.191g
0.26g
6%
Zinc
0.17mg
0.69mg
5%
Calories
541kcal
456kcal
4%
Selenium
0µg
2µg
4%
Vitamin K
8.6µg
3.6µg
4%
Vitamin A
61µg
31µg
3%
Protein
3.13g
4.01g
2%
Carbs
63.73g
71.17g
2%
Vitamin D*
3 IU
16 IU
2%
Vitamin D
0.1µg
0.4µg
2%
Magnesium
10mg
20mg
2%
Vitamin E
0.58mg
0.89mg
2%
Vitamin B1
0.02mg
0.046mg
2%
Vitamin B5
0.04mg
0.155mg
2%
Choline
3.1mg
16.5mg
2%
Potassium
153mg
124mg
1%
Iron
0.57mg
0.49mg
1%
Fiber
1.3g
1g
1%
Phosphorus
61mg
67mg
1%
Vitamin B6
0.022mg
0.014mg
1%
Vitamin B12
0.21µg
0.18µg
1%
Folate
2µg
4µg
1%
Caffeine
10mg
6mg
1%
Weight per 100 calories
18g
22g
N/A
Unsaturated / Saturated Fat ratio
0.58
0.21
N/A
Vitamin C
0.5mg
0.7mg
0%
Net carbs
62.43g
70.17g
N/A
Sugar
59.89g
59.69g
N/A
Vitamin B2
0.1mg
0.103mg
0%
Vitamin B3
0.13mg
0.154mg
0%
Trans fat
0.206g
N/A
Macronutrient Comparison
Macronutrient breakdown side-by-side comparison
1
3%
30%
64%
Protein:
3.13 g
Fats:
30.37 g
Carbs:
63.73 g
Water:
1.57 g
Other:
1.2 g
4
4%
17%
71%
6%
Protein:
4.01 g
Fats:
17.23 g
Carbs:
71.17 g
Water:
6.3 g
Other:
1.29 g
Contains
more
Fats Fats
+76.3%
Contains
more
Protein Protein
+28.1%
Contains
more
Carbs Carbs
+11.7%
Contains
more
Water Water
+301.3%
Fat Type Comparison
Fat type breakdown side-by-side comparison
2
63%
33%
4%
Saturated fat:
Sat. Fat
18.78 g
Monounsaturated fat:
Mono. Fat
9.714 g
Polyunsaturated fat:
Poly. Fat
1.191 g
1
83%
15%
2%
Saturated fat:
Sat. Fat
12.016 g
Monounsaturated fat:
Mono. Fat
2.23 g
Polyunsaturated fat:
Poly. Fat
0.26 g
Contains
more
Mono. Fat Monounsaturated fat
+335.6%
Contains
more
Poly. Fat Polyunsaturated fat
+358.1%
Contains
less
Sat. Fat Saturated fat
-36%